
AI Summary
You just collected 500 survey responses. Now what? Most people dump raw data into PowerPoint slides and call it a report. That’s not a report, that’s a data graveyard.
According to PwC’s survey of 1,000+ senior executives, highly data-driven organizations are three times more likely to report significant improvement in decision-making.
I’ve seen thousands of WPForms users struggle with the same problem: they know how to collect data, but they don’t know how to turn it into decisions.
So, I’ll walk you through how to compile and format your survey data into a report that’s both informative and visually engaging, making it easy to share insights with your team or stakeholders.
Create Your Survey Report Now! 🙂
The 7-Step Framework for Survey Results Reports
Creating a survey results is about telling a story that leads to action. After analyzing thousands of successful reports from WPForms users, I’ve identified a 7-step framework that works every time.
Start With WPForms Survey Reporting (The Easy Route)
When it comes to creating surveys on your WordPress site, WPForms with the Survey and Polls Addon handles most of the heavy lifting. The addon automatically generates visual reports with pie charts, bar graphs, and data tables.
The Survey and Polls Addon includes automatic survey reporting that creates professional-looking charts without design skills. You can export reports as PDFs, exclude irrelevant questions, and even filter results by date ranges.

But even with automated reports, understanding the structure of effective survey reporting helps you create better surveys and present findings more persuasively. Here’s the proven framework:
1. Use Data Visualization
Charts don’t just show numbers. They tell stories and make patterns obvious in a way raw data never does. That’s why survey reports with visual elements get shared more often internally and get executive sign-off faster than text-only reports.
From what I’ve seen in WPForms user data, reports with three or more well-chosen charts outperform text-heavy reports on every engagement metric we track, from time-on-page to downstream action taken. Decision-makers scanning a report in 15 minutes between meetings will remember a chart long after they’ve forgotten a paragraph.
Choose the Right Chart for Your Data Type
Most people default to pie charts for everything. Big mistake. Different data types need different visualizations.
Use pie charts when:
- Showing parts of a whole (satisfaction ratings, demographic breakdowns)
- You have 5 or fewer categories
- Percentages add up to 100%
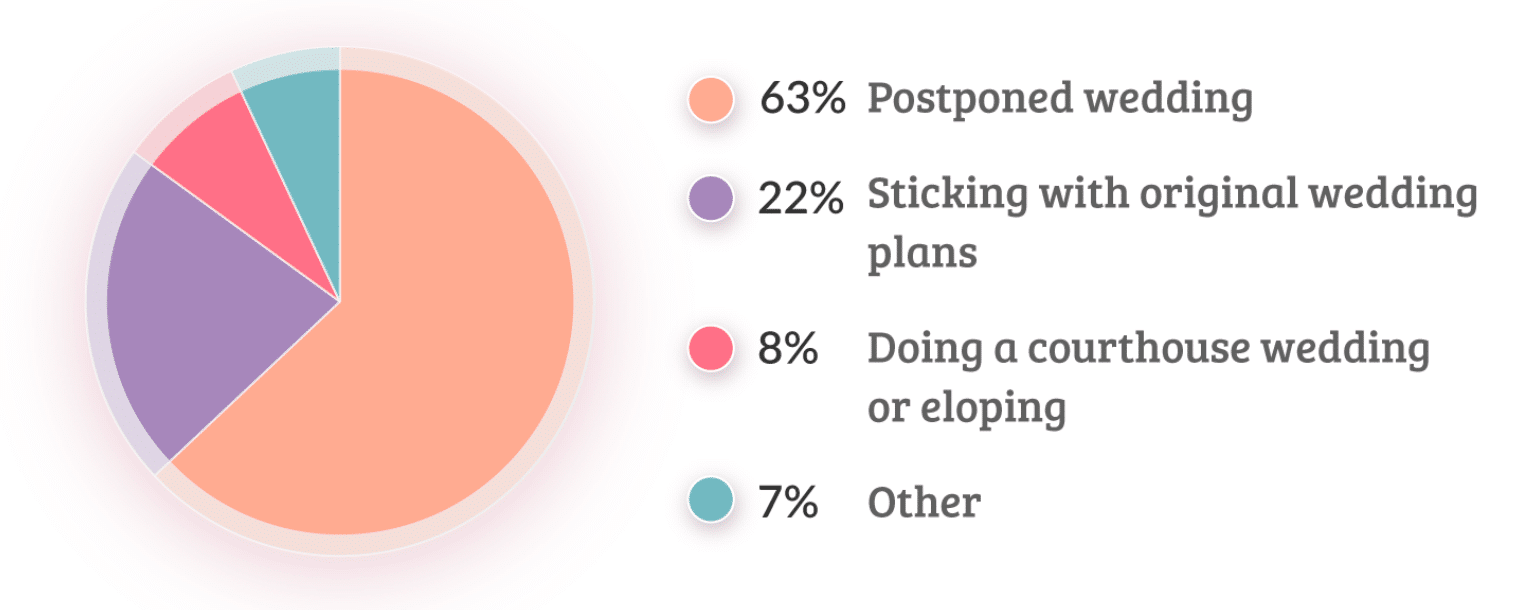
Here’s a perfect example from a wedding planning survey that shows venue preferences clearly.
Use bar charts when:
- You’re comparing quantities across categories
- You have more than 5 categories
- Values don’t need to total 100%
Use line charts when:
- Showing trends over time
- Tracking changes in responses across survey waves
- Displaying before and after comparisons
Use stacked bar charts when:
- Comparing composition across groups (e.g., satisfaction levels across departments)
- You want to show both totals and proportions in one visual
For more ideas on matching charts to data types, see our rundown of the best survey data visualization tools.
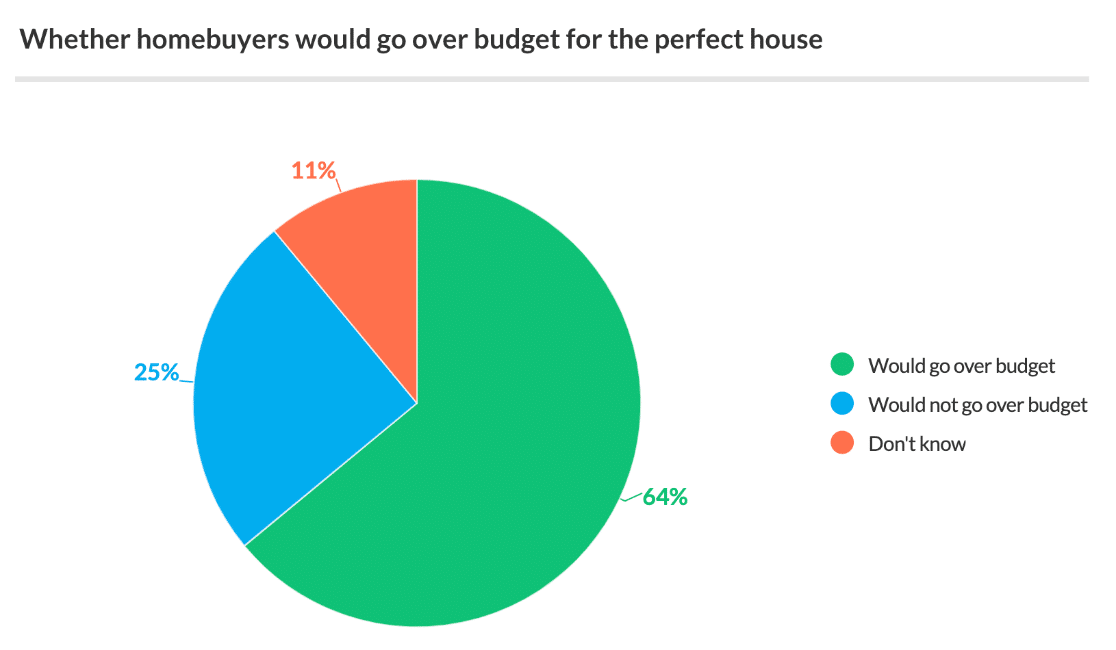
The 3-Second Rule for Survey Charts
Your chart should communicate its main message within 3 seconds of viewing. If readers need to study it longer, you’re showing too much data at once.
From this homebuyer survey, the message is instant. Most buyers want single-family homes.
What to Do With Open-Ended Responses
Open-ended survey responses can’t become pie charts, but they can become powerful quotes and themes. Instead of listing every response, group them into 3-5 main themes. Then use direct quotes to illustrate each theme.
The Color Psychology of Survey Charts
Colors guide attention and communicate meaning, so use them intentionally rather than letting your charting tool pick defaults.
- Green for positive responses, growth, approval
- Red for negative responses, problems, urgency
- Blue for neutral data, trust, stability
- Orange or yellow for caution, moderate responses
WPForms lets you customize chart colors directly in the Survey Reports section. Use this strategically to emphasize your key findings.
2. Write Key Facts First
Business executives scan reports fast. You have a few seconds before they move on to the next item in their inbox. That means your most important findings need to appear in the first paragraph, not buried on page 3.
I learned this the hard way. Early WPForms user surveys I ran had weak follow-through because I buried the key insights under methodology sections. Once I started leading with the headline finding, engagement rates jumped dramatically.
The Power of the Lead Statistic
Start your survey report with your most surprising or actionable finding. Make it impossible to ignore. Look at this example from our user research.
“73% of small businesses lose customers due to broken contact forms, yet only 12% test their forms monthly.”
That single sentence tells executives everything they need to know. The problem is big, it affects most businesses, and there’s a simple solution most people ignore.
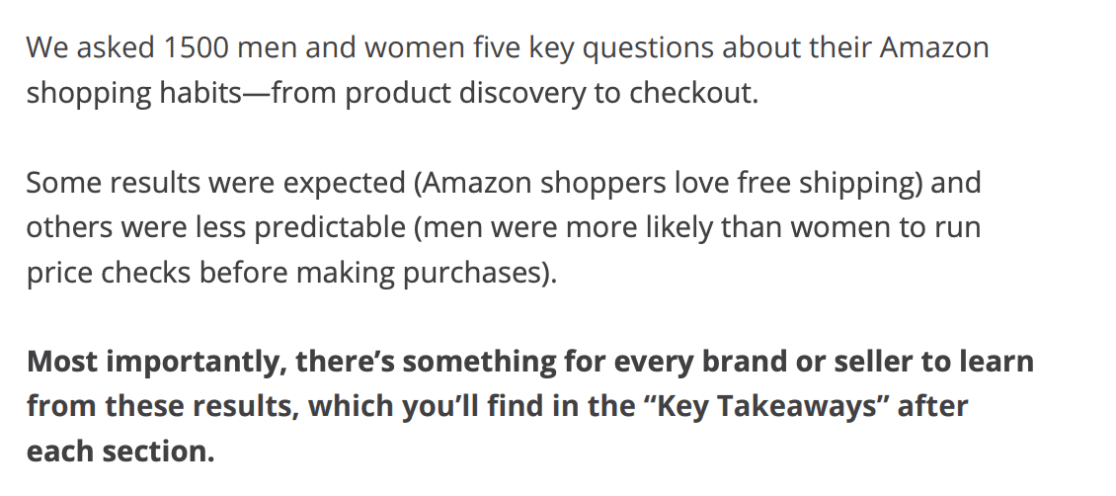
Examples of Survey Summaries With Key Facts
Here’s how effective survey introductions grab attention immediately. The key finding appears first, followed by supporting context.

This approach works because busy readers can stop after the opening and still understand your main message. Everything else becomes supporting evidence.
If you need help deciding which questions to ask in your survey, check out our guide to the best survey questions to include.
The “So What?” Test
Every key fact needs to pass the “so what?” test. Don’t just state what you found. Explain why it matters.
- Weak. “45% of respondents prefer email communication.”
- Strong. “45% prefer email communication, meaning our current phone-only support strategy misses nearly half our customers.”
Structure Your Opening for Maximum Impact
Follow this proven formula for your opening paragraph.
- The headline number (your biggest finding)
- What it means (business impact in plain language)
- The context (why this matters now)
- The preview (what the rest of the report covers)
When to Write Your Introduction
Write your key facts section first, but only after you’ve analyzed all your data. Only then will you know what your most important findings actually are.
I see too many people write generic introductions before they know what story their data tells. The introduction should feel like a movie trailer for your full report.
3. Write a Short Survey Summary
Your survey summary should give decision-makers everything they need in one page. Not one page plus attachments. Not one page of tiny text. One readable page that covers the essentials.
Executive summaries should be no more than 10% of your total report length. For most survey reports, that means 250-400 words maximum. Any longer and executives stop reading.
Survey summaries are also called executive summaries because they’re designed to be quickly digested by decision-makers who have 12 other reports to review today.
The 4-Paragraph Structure That Works
After reviewing hundreds of successful survey reports from WPForms users, this structure consistently gets the best response.
- Paragraph 1. Your headline finding and its business impact
- Paragraph 2. Two supporting findings that reinforce the main message
- Paragraph 3. What caused these results (context)
- Paragraph 4. Recommended actions with timelines
Examples of Short Survey Introductions
One way to keep a survey summary short is to use a teaser approach that creates curiosity.
This introduction works because it promises valuable insights without overwhelming the reader with details. It creates urgency while staying concise.
Here’s another effective approach that summarizes findings in one powerful sentence.

How to Trim Your Summary Without Losing Impact
Start with everything you want to say, then cut 50%. Here’s how.
- Remove methodology details. Save technical explanations for appendices. Executives care about findings, not how you found them.
- Combine related findings. Instead of “45% said X, 32% said Y, 23% said Z,” write “Most respondents (77%) preferred options other than our current approach.”
- Delete qualifier words. Remove “somewhat,” “relatively,” “fairly,” and “quite.” These words weaken your message and waste space.
- Use active voice. “We surveyed 500 customers” not “500 customers were surveyed.” Active voice is shorter and stronger.
Pro Tip
In WPForms, you can exclude irrelevant questions from your printed report. If a question received no responses or doesn’t support your main findings, remove it from the PDF.
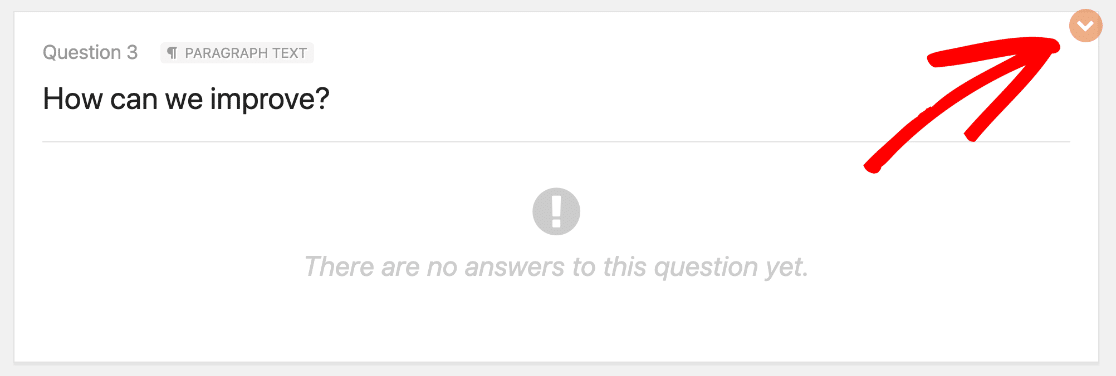
Click the arrow next to any question to exclude it from your final report. This feature alone can cut report length by 30-40% while improving focus.
The Table of Contents Decision
For one-page summaries, skip the table of contents. For longer reports (3+ pages), include it on the summary page. Keep it simple, just section names and page numbers.
Your goal is helping busy readers jump to what they need most. Remember that your summary competes with emails, Slack messages, and urgent calls for attention. Make it scannable, actionable, and impossible to misunderstand.
4. Explain Your Survey Motivation
Every survey report needs to answer one critical question. Why should anyone care about this data right now? If you can’t answer that in 2-3 sentences, your survey probably shouldn’t have happened in the first place.
According to research on business report effectiveness, reports that clearly convey study importance and justification get 3.4x more executive engagement than those that skip context.
The Business Case in 30 Words
Your survey motivation should fit in a tweet. If you can’t explain why the survey matters in 30 words, you’re either solving the wrong problem or haven’t thought clearly about the business case.
Good example.
“Customer complaints increased 47% this quarter. We surveyed 500 recent customers to identify specific pain points and create an action plan before Q4 renewals.”
Bad example.
“We wanted to understand customer sentiment and gather feedback about various aspects of our service delivery to inform future strategic initiatives and operational improvements.”
The first version tells you exactly why the survey happened and what’s at stake. The second is corporate word salad.
Connect to Business Impact
Always link your survey to measurable business outcomes. Don’t just say you want to “improve customer satisfaction.” Say you want to “reduce churn from 12% to 8% by fixing the top 3 customer pain points.”
Examples of Intros that Explain Motivation
This vehicle survey clearly states its business purpose upfront.

The introduction works because it connects survey findings directly to future planning decisions. Readers immediately understand why this data matters for the organization.
For example, if you’re running a demographic survey, you might want to clarify that you’ll use this information to target your audience more effectively.
Timing Matters More Than You Think
Explain why you conducted the survey now, not six months ago or six months from now. Connect to current events, business cycles, or strategic initiatives.
- “With our biggest competitor launching next month…”
- “Before we finalize the Q4 budget…”
- “Following last month’s product launch…”
- “As we prepare for the busy season…”
This template forces you to be specific about problems, impacts, and outcomes. Generic motivations get generic attention. Specific motivations get executive action.
5. Put Statistics in Context
Raw numbers without context are meaningless. If I tell you “Customer satisfaction averaged 7.2 out of 10,” you can’t judge if that’s good or terrible.
Context transforms data into insights. That same 7.2 satisfaction score means completely different things depending on your industry, previous scores, or competitor benchmarks. A strong survey analysis report always presents numbers alongside a reference point.
The 4 Types of Context That Matter
- Historical context (how you’ve changed). “Customer satisfaction improved from 6.1 last quarter to 7.2 this quarter, the highest score in company history.”
- Industry context (how you compare). “Our 7.2 satisfaction score exceeds the industry average of 6.8 but falls short of top performers (8.3+).”
- Competitive context (how others perform). “While our satisfaction increased to 7.2, our main competitor achieved 8.1 in their recent public survey.”
- Goal context (how close you are). “Our 7.2 satisfaction score puts us 78% of the way to our year-end target of 8.0.”
Examples of Survey Statistics in Context
Here’s how to turn flat statistics into a clear narrative using context.
This example works because it doesn’t just report what customers said. It explains what those responses mean for the business and connects findings to specific business outcomes.
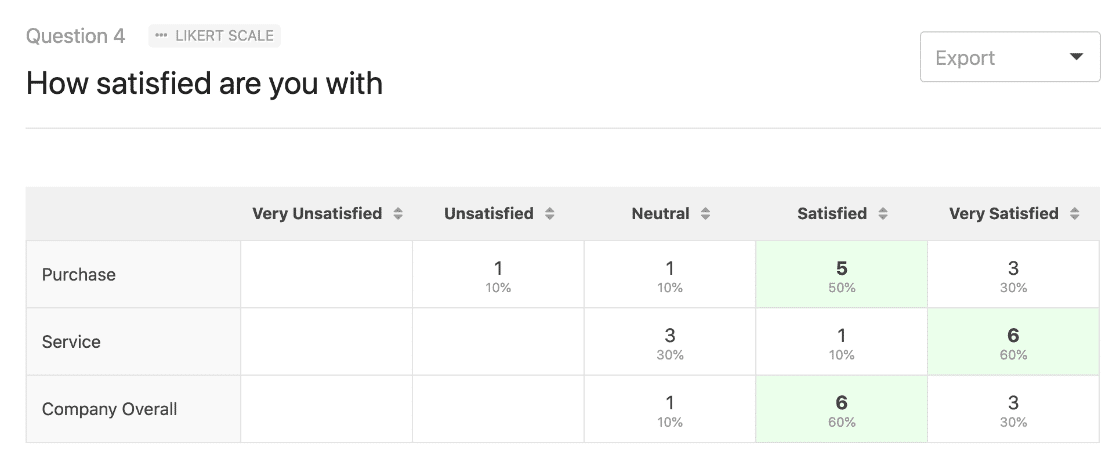
The table format makes it easy to spot patterns and compare responses across different questions. Raw percentages would be harder to interpret quickly.
If you’d like to use a Likert scale to produce a chart like this, check out this article on the best Likert scale questions for survey forms.
6. Tell Readers the Outcome
Now that your survey report is done, you’ll likely want action taken based on your findings. That’s why making a specific recommendation is so important. Don’t leave readers guessing what they’re supposed to do with your data.
If you already explained your reasons for creating the survey, you can naturally add a few sentences on the outcomes you want to see.
Examples of Survey Introductions with Recommendations
Here’s a nice example of a survey introduction that clearly states the outcomes that the organization would like to happen now that the survey is published.

This helps focus the reader on the content and explains why the survey is important. Respondents are more likely to give honest answers if they believe a positive outcome will come from the survey.
You can also cite related research here to give your reasoning more weight.
Make Your Recommendations Specific
Vague recommendations get ignored. Specific ones get scheduled on a calendar. Compare these two.
- Vague. “We should improve our onboarding process.”
- Specific. “Within 30 days, redesign the first-login email sequence to address the three confusion points flagged by 42% of new users. Assign to the growth team. Measure via 7-day activation rate.”
The specific version tells someone exactly what to build, who builds it, by when, and how you’ll know it worked.
7. Export in Multiple Formats
You can easily create pie charts in the WPForms Surveys and Polls addon. It lets you change how your charts look without being overwhelmed by design options.
This feature saves hours when you’re composing your survey results.
Once you have your charts, exporting them lets you use them in other ways. You may want to embed them in marketing materials like:
- Presentation slides
- Infographics
- Press releases
- Blog posts
WPForms makes it easy to export any graphic from your survey results so you can use it on your website or in slides. Just use the dropdown to export your survey pie chart as a JPG or PDF.
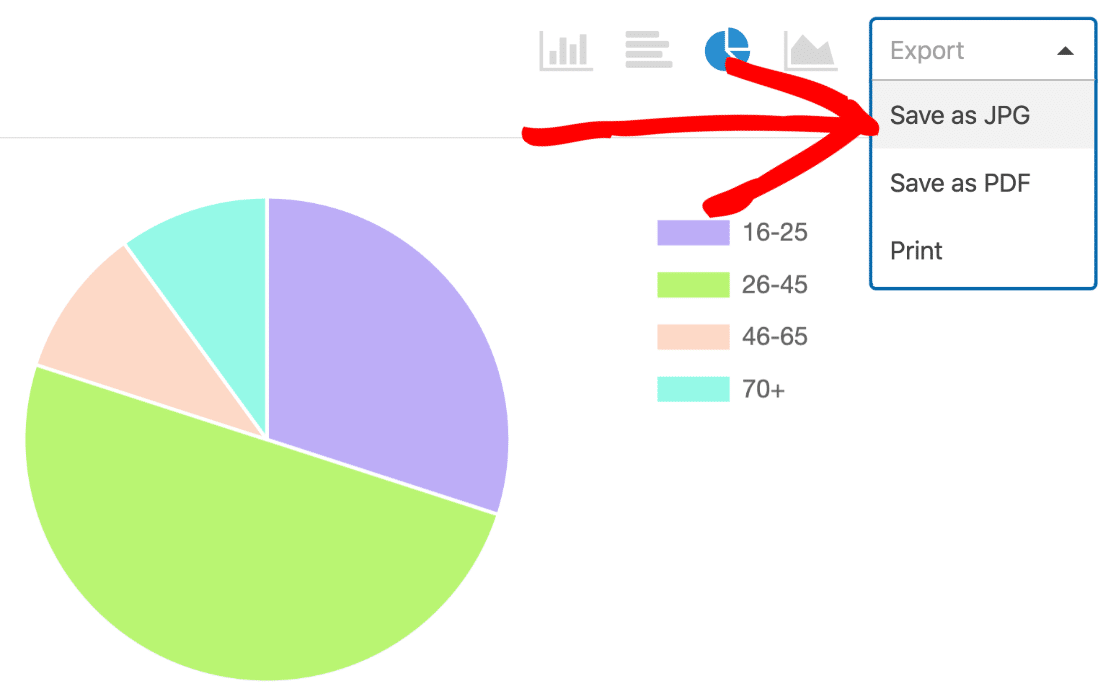
Once your charts are exported, you can drop them straight into a presentation, a report template, or a blog post without any reformatting.
Survey Results Report Examples You Can Steal
The framework above works for any survey, but the way you frame a customer satisfaction report is different from the way you frame an NPS report or a post-event debrief. Here are 7 common survey report formats, what each one should include, and when to use them.
1. Customer Satisfaction (CSAT) Report
A CSAT report measures how satisfied customers are with a specific interaction, product, or overall service. The core metric is the percentage of respondents who rated their experience as “satisfied” or “very satisfied.”
What to include.
- Overall CSAT score (as a percentage)
- Score breakdown by segment (product line, region, customer tier)
- Top three drivers of satisfaction and dissatisfaction
- Verbatim quotes from the highest and lowest scorers
- Quarter-over-quarter trend chart
Use this when you want to benchmark service quality over time or compare performance across teams. For real-world examples, see our roundup of customer satisfaction survey examples.
2. Employee Engagement Report
An employee engagement report measures how committed, motivated, and connected your team feels to the organization. These are usually pulse surveys run quarterly with a small number of high-signal questions.
What to include.
- Engagement score (often a Likert-scale composite)
- Department-by-department breakdown (anonymized where needed)
- Year-over-year change
- Open-ended themes from “what would make this a better place to work?”
- Recommended actions tied to the lowest-scoring dimensions
Use this when HR or leadership needs to diagnose culture issues or justify investments in retention. The top employee satisfaction survey questions are a good starting point for the questionnaire.
3. Net Promoter Score (NPS) Report
An NPS report tracks customer loyalty by asking a single question: how likely are you to recommend us? Respondents are grouped into Promoters (9-10), Passives (7-8), and Detractors (0-6), and your NPS is the percentage of Promoters minus the percentage of Detractors.
What to include.
- NPS score (single number, prominently displayed)
- Distribution chart showing Promoters, Passives, and Detractors
- Segmented NPS (by plan tier, cohort, geography)
- Follow-up reasons from Detractors (the most valuable data in the report)
- Benchmark comparison (industry NPS averages)
Use this when you want one trendable number that summarizes customer loyalty. WPForms has a dedicated NPS field, and our guide on how to calculate NPS walks through the math.
4. Product Feedback Report
A product feedback report consolidates what users are saying about a specific product or feature, usually after a launch or during a development cycle. It’s less about one number and more about themes.
What to include.
- Feature satisfaction ratings (1-5 or 1-10 scale)
- Top requested improvements (ranked by frequency)
- Bug or friction reports with severity
- User quotes organized by theme
- Recommendations for the next sprint or roadmap item
Use this when a product manager needs to prioritize what to build next. A set of well-chosen feedback form questions keeps the survey short enough that users actually finish it.
5. Post-Event Feedback Report
A post-event report captures attendee reactions to a webinar, conference, or internal meeting. The goal is to improve the next one, so keep the survey short and the report scannable.
What to include.
- Overall event rating
- Session-by-session rating breakdown
- Logistics ratings (venue, tech, food, signage)
- Speaker ratings if relevant
- Top three “what would you change?” themes
- Intent-to-return or intent-to-recommend metric
Use this when you need a quick turnaround report within 48 hours of an event, while feedback is fresh.
6. Website or UX Research Report
A UX research report summarizes what users think about your website, app, or onboarding flow. It typically combines quantitative ratings with qualitative observations.
What to include.
- Task completion rates (percentage who completed each key action)
- Usability ratings (often via SUS or a 1-7 ease-of-use scale)
- Heatmap or click-path summary if you have it
- Direct quotes tied to specific pages or screens
- Prioritized list of usability issues (high, medium, low)
Use this when you’re planning a redesign or want to validate (or kill) assumptions before building. You can collect this data through a WordPress form linked from key pages or embedded in a popup feedback form.
7. Market Research Report
A market research report is broader than the others. It’s designed to inform go-to-market decisions, pricing, or positioning.
What to include.
- Executive summary (mandatory, 200-300 words)
- Respondent demographics and sample size
- Market sizing or segmentation findings
- Competitive positioning (how respondents perceive you vs competitors)
- Willingness-to-pay or pricing-sensitivity data
- Strategic recommendations for leadership
Use this when you’re preparing for a product launch, entering a new market, or defending a pricing decision. These reports tend to be the longest, but the executive summary still needs to fit on one page.
Bonus Tip: Export Data for Survey Analysis
WPForms is one of the best form builder plugins for WordPress, and on top of survey-specific tooling it also has solid data export options.
You’ll often want to export form entries to analyze them in other tools. You can do exactly the same thing with your survey data.
For example, you can:
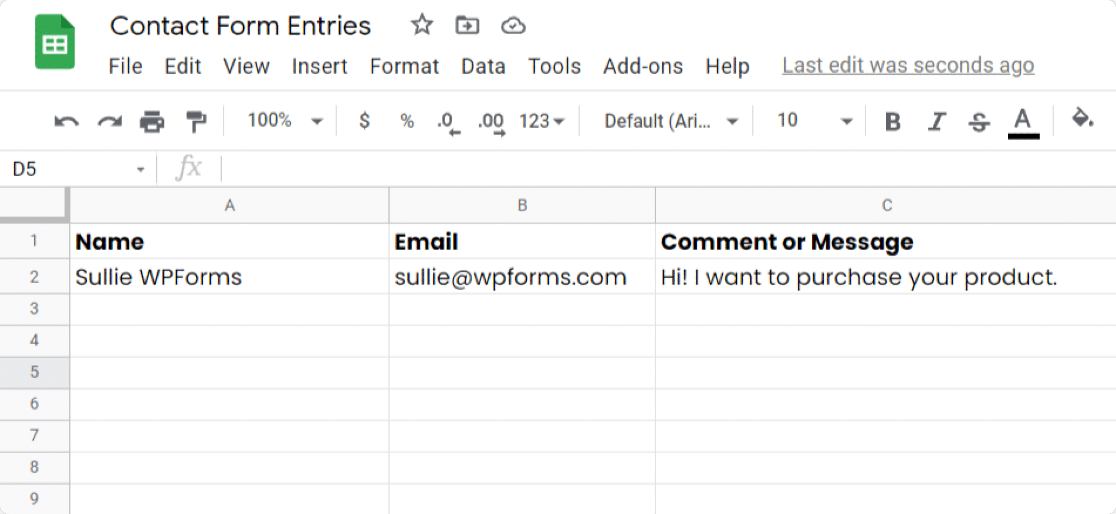
- Export your form entries or survey data to a spreadsheet
- Automatically send survey responses to a Google Sheet
I really like the Google Sheets addon in WPForms because it sends your entries to a Google Sheet as soon as they’re submitted. And you can connect any form or survey to a Sheet without writing any code.
The Google Sheets integration is powerful enough to send all of your metrics. You can add columns to your Sheet and map the data points right from your WordPress form.
This is an ideal solution if you want to give someone else access to your survey data so they can crunch the numbers in spreadsheet format.
FAQs on Writing a Survey Results Report
Survey reporting is one of the most common questions we get from WPForms users who run different types of surveys. Here are answers to the ones that come up most often about writing a survey results report.
What is a survey report and what should it include?
A survey report compiles all data collected during a survey and presents it objectively. The report should include an executive summary, methodology, respondent demographics, key findings with supporting visuals, context or benchmarks, and clear recommendations for action.
How do you present survey results in an impactful way?
The best way to present survey results is to use visualizations. Charts, graphs, and infographics make survey outcomes easier to interpret at a glance.
For online surveys, WPForms has a Surveys and Polls addon that makes it easy to publish many types of surveys and collect data using special survey fields.
- Likert scale
- Net Promoter Score
- Star Rating
- Single Line Text
- Checkboxes
- Multiple Choice
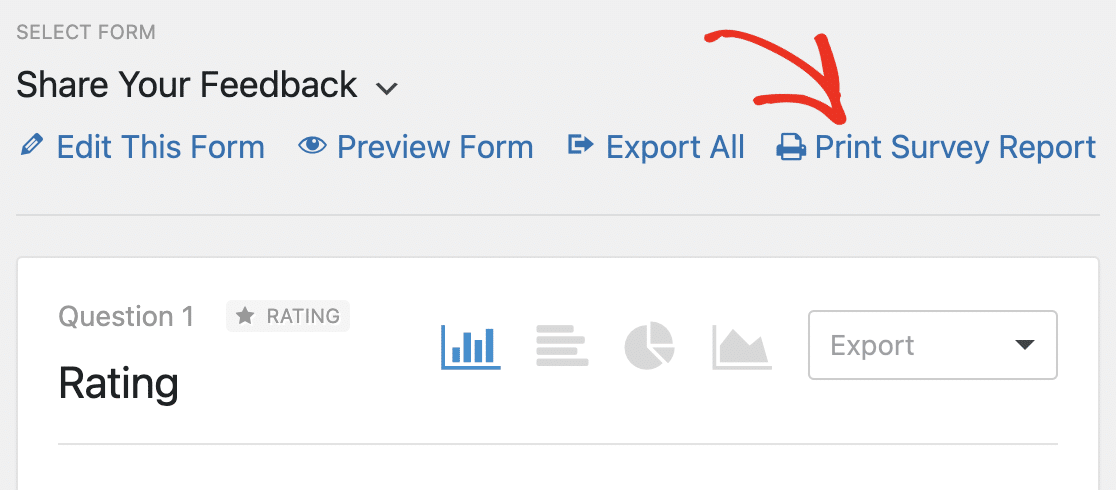
You can turn on survey reporting at any time, even if the form has stopped accepting new entries. To present your results, create a polished PDF by clicking Print Survey Report right from the WordPress dashboard.
How long should a survey results report be?
Most survey results reports fall between 5 and 15 pages, including an executive summary, key findings, and recommendations. For executive audiences, one-page summaries work best, with the full data appended as supporting material. For operational or research-focused teams, longer reports with full methodology and appendices are expected.
How do you analyze survey results?
Start by cleaning the data (remove incomplete or duplicate responses), then segment it by the variables that matter (customer tier, region, plan, tenure). Run basic descriptive statistics on each segment, look for significant differences between groups, and thematically code any open-ended responses. Visualize the patterns before writing them up so you can spot what’s worth highlighting.
What software is best for creating survey results reports?
For WordPress users, WPForms with the Surveys and Polls addon collects data, auto-generates charts, and lets you export branded PDFs without leaving your dashboard. For more complex statistical work, export to a spreadsheet or a dedicated analysis tool. For presentation-ready visuals, pair the WPForms export with a slide deck tool or a design platform for the final polish.
Next, Create a Survey That Gets Honest Answers
A great survey results report depends on great survey data, and great survey data depends on asking the right questions in the right format.
If you’re building the survey itself, start with our step-by-step guide on how to create a survey form in WordPress. From there, you can explore more specialized survey types that fit specific goals.
Ready to build your form? Get started today with the easiest WordPress form builder plugin. WPForms Pro includes lots of free templates and offers a 14-day money-back guarantee.
If this article helped you out, please follow us on Facebook and Twitter for more free WordPress tutorials and guides.


This is really good
Hi Jocasta! Glad to hear that you enjoyed our article! Please check back often as we’re always adding new content as well as updating old ones!
Hi, I need to write an opinion poll report would you help with a sample I could use
Hi Thuku, I’m sorry but we don’t have any such examples available as it’s a bit outside our purview. A quick Google search does show some sites with information and examples regarding this though. I hope that helps!
With the Likert Scale what visualisation options are available? For example if there were 30 questions… I would like to be able to total up for all questions how many said never, or often… etc… and for each ‘x’ option for example if it was chocolate bars down the side and never through to often across the top… for each question… I would like to total for all questions for each chocolate bar… the totals of never through to often…? can you help?
Hey Nigel- to achieve what you’ve mentioned, I’d recommend you to make use of the Survey and Poll addon that has the ability to display the number of polls count. Here is a complete guide on this addon
If you’ve any questions, please get in touch with the support team and we’d be happy to assist you further!
Thanks, and have a good one 🙂
Hello,
I am looking for someone to roll-up survey responses and prepare presentations/graphs. I have 58 responses.
Does this company offer this as an option? If so, what are the cost?
Hi Ivory! I apologize for any misunderstanding, but we do not provide such services.
Hi!
Can you make survey report.
Hi Umay! I apologize as I’m not entirely certain about your question, or what you’re looking to do. In case it helps though, our Survey and Polls addon does have some features to generate survey reports. You can find out more about that in this article.
I hope this helps to clarify 🙂 If you have any further questions about this, please contact us if you have an active subscription. If you do not, don’t hesitate to drop us some questions in our support forums.
Super helpful..
Hi Shaz! We’re glad to hear that you found this article helpful. Please check back often as we’re always adding new content and making updates to old ones 🙂
Thanks!
Hi , can you help meon how to present the questionnaire answer on my report writing
Hi Elida – Yes, we will be happy to help!
If you have a WPForms license, you have access to our email support, so please submit a support ticket. Otherwise, we provide limited complimentary support in the WPForms Lite WordPress.org support forum.
Thanks!