Keeping up to date with the latest eCommerce statistics and data is essential to stay informed and ahead of the curve. The world of online shopping has opened up unprecedented opportunities for businesses of all sizes, allowing you to reach customers far beyond the confines of traditional brick-and-mortar stores.
From understanding consumer behavior to spotting emerging trends, these insights can help you make informed decisions, tailor your strategies, and ultimately, drive your eCommerce growth.
We’ve scoured the latest studies and reports to find key insights to help you grow your eCommerce business. Whether you’re just starting your online journey or looking to boost your eCommerce revenue, these statistics will give you an overview of the current state of online shopping.
- What Does the eCommerce Sector Look Like in 2024?
- What Can We Learn From eCommerce Shopping Habits and Behavior?
- What Do I Need to Know About eCommerce Customer Experience?
- How Does Email Marketing Impact eCommerce Sales?
- How Does Social Media Impact eCommerce?
- What Are the Most Important Mobile eCommerce Statistics?
- What Can We Learn From Shopping Cart eCommerce Statistics?
- What Are the Most Important eCommerce Payment Statistics?
- How Many eCommerce Sites Are There in 2024?
What Does the eCommerce Sector Look Like in 2024?
The growth rate of retail eCommerce sales is absolutely astounding and it’s not slowing down any time soon, as the stats in this post will prove.
So without further ado, let’s take a look at some eCommerce statistics you must know for the coming years.
Simply put, eCommerce is commercial transactions that take place electronically online. And by the year 2026, eCommerce is expected to generate over $8.1 trillion in sales per year. If you’re thinking the future looks bright for those selling products online, these stats definitely back that up.
1. There are over 2.14 billion online shoppers in the world. (Tidio)
2. 27% of the global population shop online. (Tidio)
3. The global eCommerce market is predicted to exceed $8.1 trillion by 2026. (Statista)
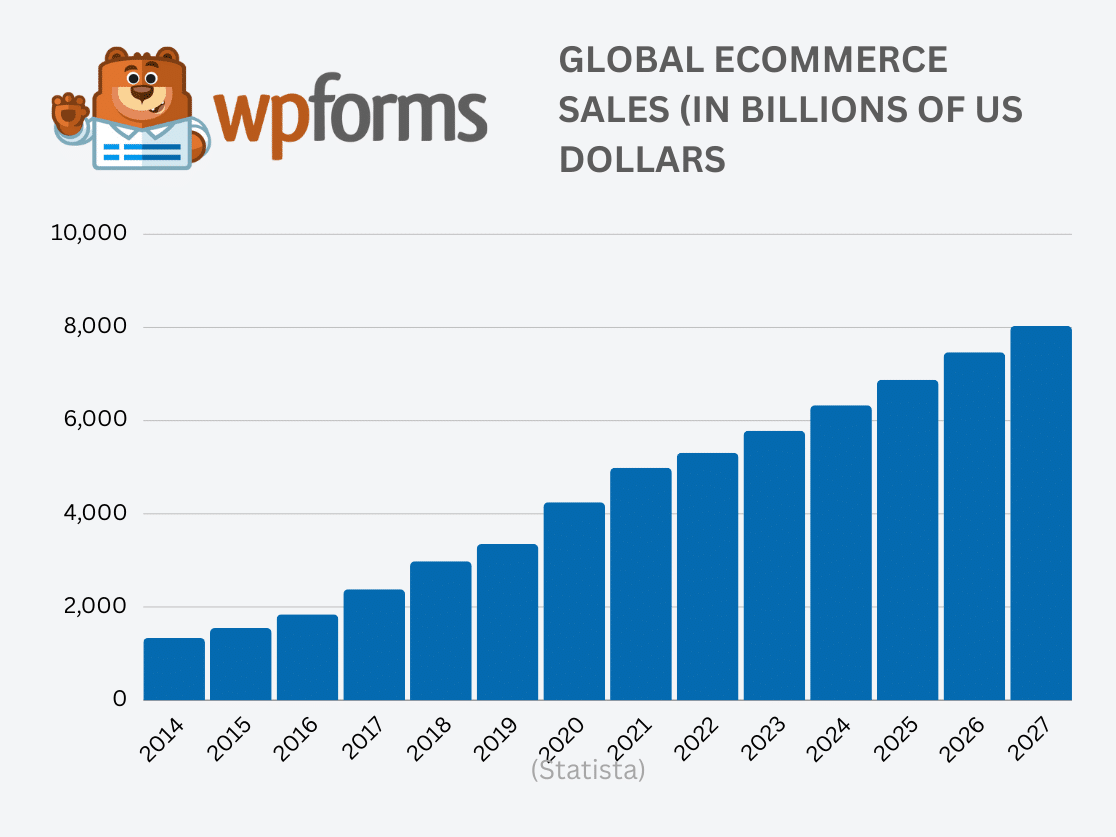
4. 20% of all retail sales happen online. This figure is expected to reach 25% by 2025. (Tidio)
5. Amazon is the biggest eCommerce website globally, accounting for over 13% of visits from desktop devices – 4x as many as eBay. (Statista)
6. Amazon sold over 300 million items worldwide during Prime Day 2022. (Amazon)
7. There are over 12 million online stores globally. (Tidio)
8. The average ecommerce conversion rate is 3.65%. (Adobe)
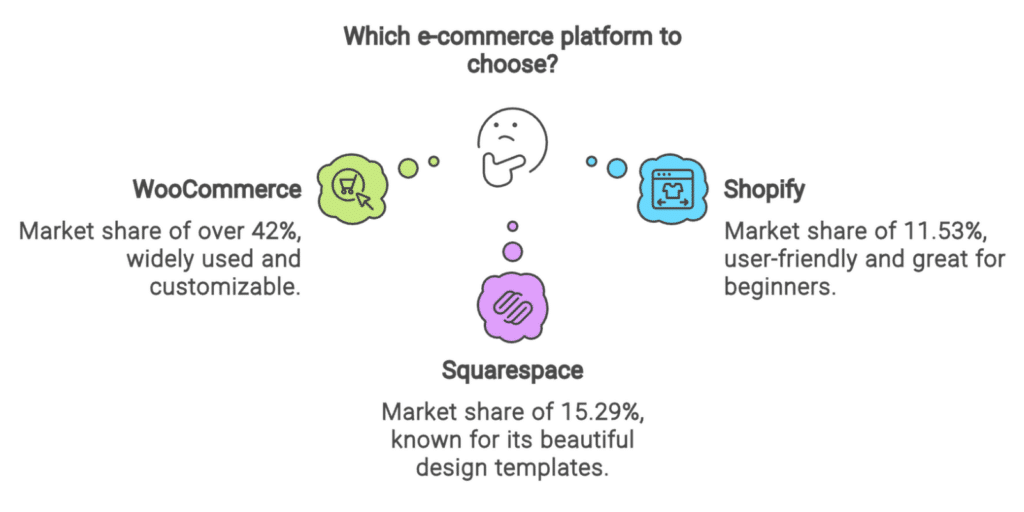
9. WooCommerce owns over 42% of the market share of eCommerce platforms. Shopify has a market share of 11.53% and Squarespace stores account for 15.29% (Datanyze)
10. The average customer spend globally is $2,310 per person, per year. (Tidio)
11. Amazon is making an AI-based, real-time product recommendation engine available to sellers who use the AWS console. (Absolunet)
12. Companies that invest in AI are seeing an increase in sales ROI of 10-20%. (McKinsey & Company)
13. It’s predicted that 95% of all purchases will be online by 2040, with only 5% of sales taking place in a physical store. (Instapage)
14. In 2024, global eCommerce sales are expected to grow 10.1% year on year, while in-store sales are expected to grow only 2%. (eMarketer)
What Can We Learn From eCommerce Shopping Habits and Behavior?
As consumers increasingly turn to the internet for their purchasing needs, understanding changing shopping habits becomes crucial for businesses aiming to thrive online. These statistics offer insight into the preferences, motivations, and decisions of today’s digital shopper.
1. In countries where Amazon is well established, 60% of shoppers use it to search for products. (Wunderman Thompson)
2. 57% of US shoppers buy Christmas presents online. (Tidio)
3. 84% of Gen-Z, 82% of Millennials, 80% of Gen-X and 73% of Baby Boomers are more likely to buy from a company that treats its employees well. (Hubspot)
4. 67% of shoppers have made a cross-border purchase. (Flow.io)
5. 46% of consumers say they’re more likely to buy from a company that actively tries to reduce its environmental impact. (Hubspot)
6. 60% of Gen-Z and 59% of Millennials are more likely to choose products made by small businesses. (Hubspot)
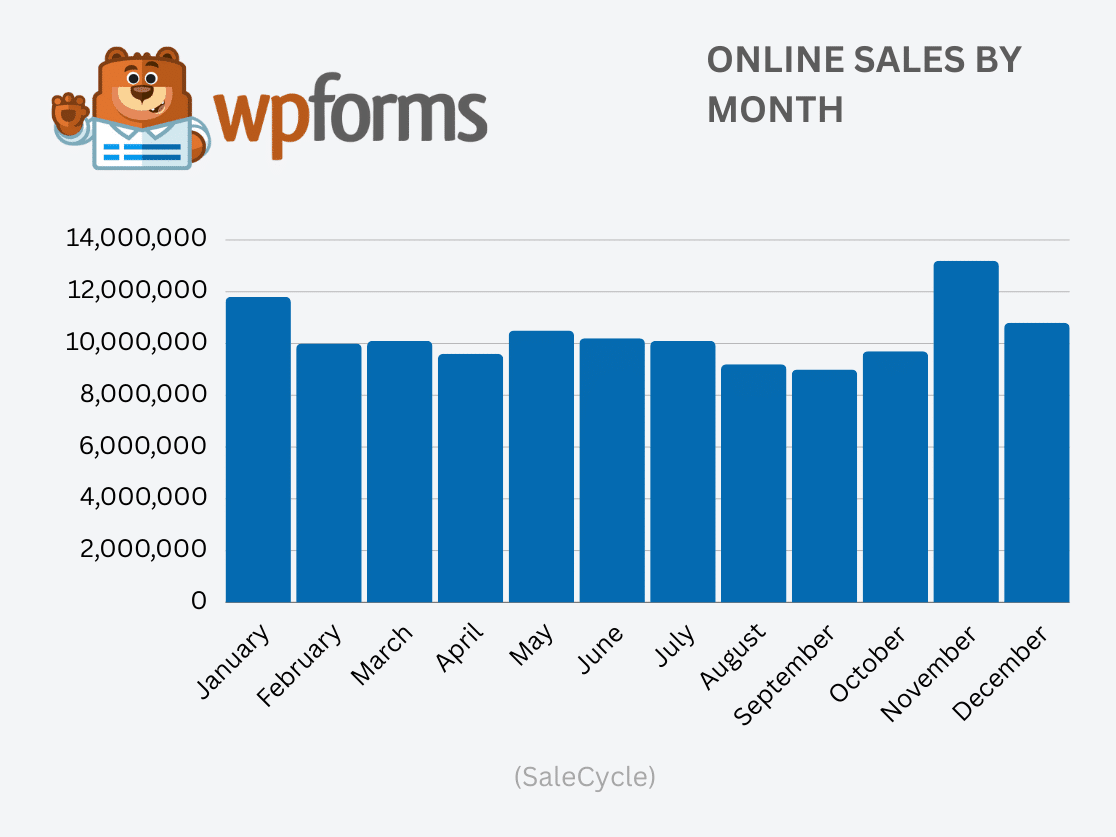
7. November is the busiest shopping month of the year, with events like Black Friday and Cyber Monday resulting in sales 12% – 140%+ higher than all other months of the year. Online sales drop to their lowest during the summer months. (SaleCycle)
8. Online sales peak during the 25th – 28th of the month. Cart abandonment rate also reduces during the last few days of the month. This trend is attributed to to payday for most companies being near the end of the month. (SaleCycle)
9. Holiday sales account for 20% of all retail sales. (OptinMonster)
10. Over 99.9% of customers read reviews when they shop online. (PowerReviews)
11. 49% of consumers trust reviews as much as personal recommendations from friends and family members. (Brightlocal)
What Do I Need to Know About eCommerce Customer Experience?
To be successful in eCommerce, understanding the customer experience is not just essential. The statistics surrounding eCommerce customer experience shed light on consumer behaviors, preferences, and the key factors that drive satisfaction and loyalty.
1. eCommerce spending via conversational marketing channels is forecast to reach 290 billion dollars by 2025. (Statista)
2. 46% of Gen Z digital buyers are willing to pay more for the same product if they can shop in their favorite online store. (Tidio)
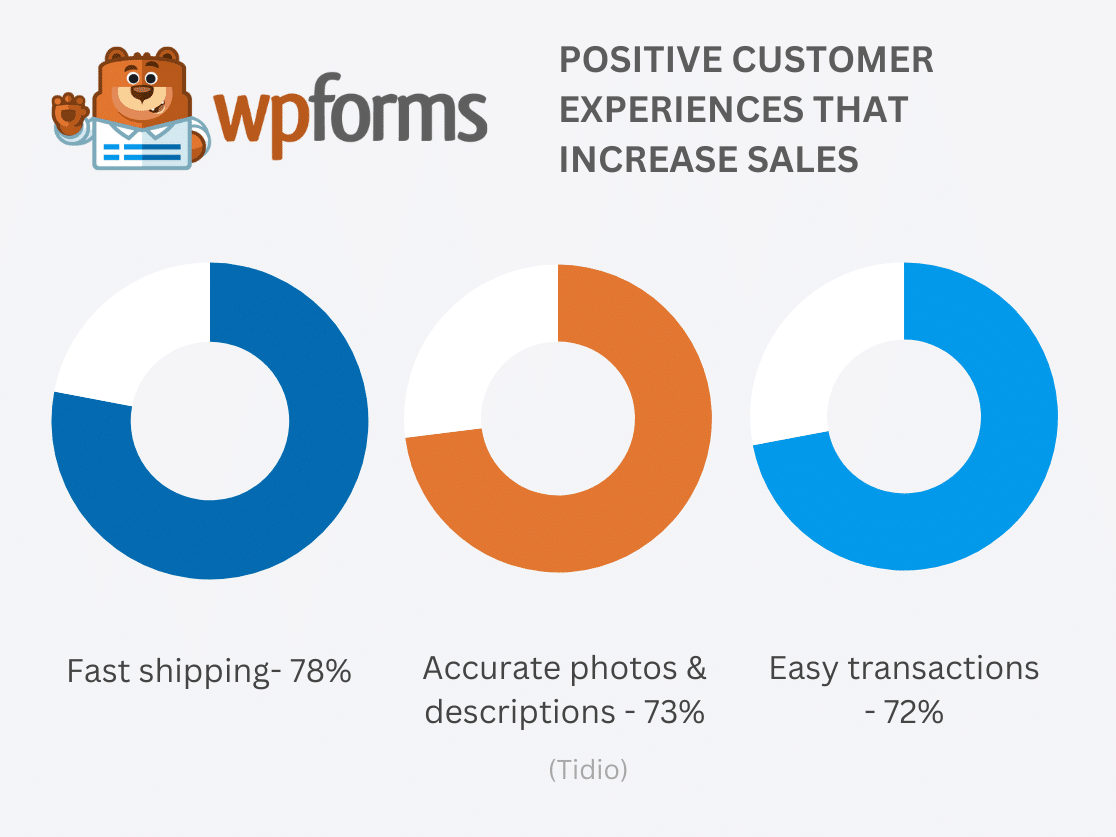
3. Fast shipping and delivery is the most important factor that influences an online shopper to make a purchase, with 78% of frequent buyers citing this as the top deciding factor. Other important factors include the accuracy of product descriptions and photos 73% and having a convenient buying process (72%). (Tidio)
4. 76% of consumers are more likely to buy from eCommerce sites that use personalization. (McKinsey & Company)
5. 35% of people say that they would be shopping online more if they could virtually try on a product before buying it. (BigCommerce)
6. Buggy websites, lack of information about product availability and shipping costs, and poor site navigation are the most frustrating factors relating to a bad customer experience. (Tidio)
7. Almost 79% of shoppers would not complete their order if the customer service was unresponsive. (Tidio)
8. 56% of consumers say they would most likely become a repeat customer if a brand used eCommerce personalization to customize their shopping experience. (Twilio Segment)
9. 12% of customers will leave a review if explicitly asked to do so but this figure doubles (26%) if they’re offered an incentive such as a discount code in exchange for a review. (Tidio)
10. 6 out of 10 American shoppers prefer to use self-service tools for customer service, including websites (24%), mobile apps (14%), voice response systems and VoIP (13%). (Raydiant)
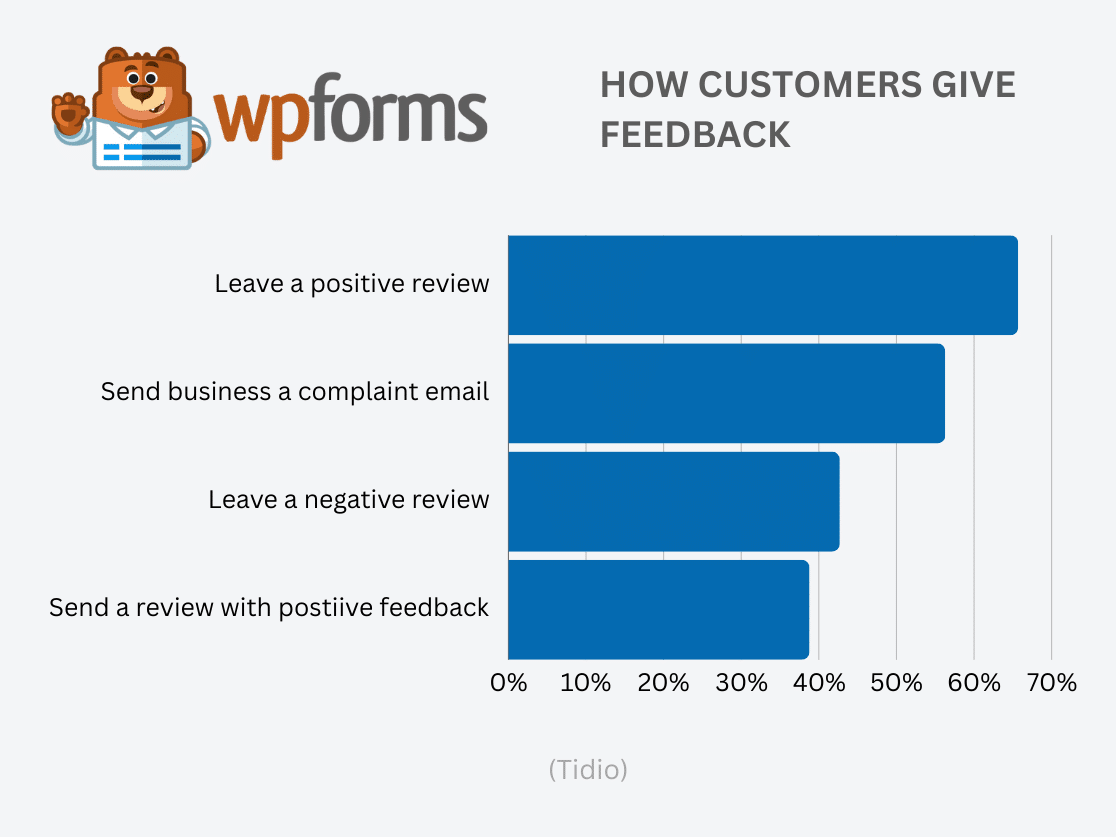
11. 66% of US customers leave positive reviews when they’re happy with a shopping experience but they’re more likely to email or send a message with a complaint rather than leaving a negative review (56% vs 42%). (Tidio)
12. Over 40% of online shoppers are willing to pay extra for unlimited free shipping. (Tidio)
How Does Email Marketing Impact eCommerce Sales?
Email has the highest ROI out of all other marketing campaigns, so using it is super important to growing your business online. It’s a fantastic tool to use to generate leads and nurture customer relationships. If you aren’t already using email marketing, make sure to check out this post on the best email marketing services to find one that works for you.
1. Industries with the best-performing eCommerce emails include books & literature (2.63%), hobbies & leisure (1.60%), auto (1.53%), toys & games (1.40%), and pet supplies (1.39%). The lowest performing were consumer electronics and apparel (0.05%). (Omnisend)
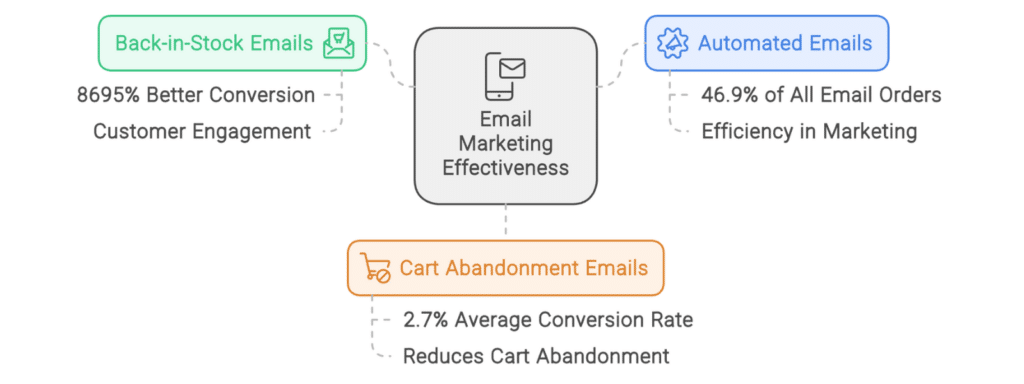
2. Back-in-stock emails convert 8695% better than generic marketing emails. (Omnisend)
3. Automated emails make up 46.9% of all email orders. (Omnisend)
4. Sending messages 1 hour, 24 hours, and 72 hours after a cart abandonment can improve campaign performance by up to 30%. (SaleCycle)
5. Cart abandonment emails have an average conversion rate of 2.7%. (Omnisend)
6. 50.2% of consumers say they would click through to learn more about the offer or use the promo code on a discount email. (Mailjet)
8. 78.5% of respondents want to hear from the brands they love at least once a week, (Mailjet)
9. 4% of respondents say they subscribe to regularly receive special offers, and 52.5% sign up to newsletters to receive a one-off discount. (Mailjet)
10. Nonprofits lose about $15k/year in donations due to spam filters blocking fundraising campaign emails. (EveryAction)
11. 13% of non-profit donations are generated from email appeals. (EveryAction)
12. 27% of US consumers stated it was likely or very likely that a brand’s regular newsletter sent to email subscribers would influence them to purchase something. (Statista)
13.7% of eCommerce marketers say increasing brand awareness is the main goal of their email strategy. (Hubspot)
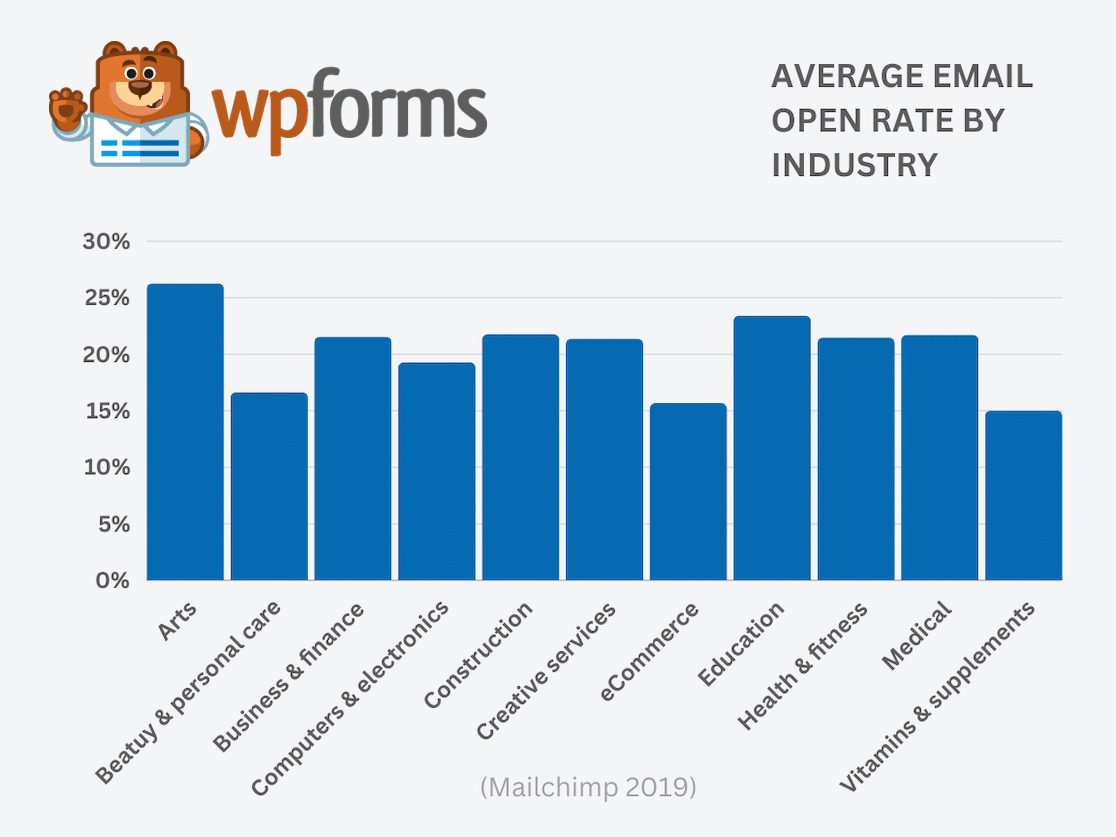
14. 72% of eCommerce marketers agree their biggest email marketing challenge is low open rates. (Hubspot)
15. Email campaigns with three cart abandonment emails generate the most revenue – over 41x the revenue of those with only one email. (Klaviyo)
We’ve got even more email marketing statistics for you to check out if you want to see more.
How Does Social Media Impact eCommerce?
Your brand can experience a substantial increase in profits by integrating social media into your digital marketing strategy.
Social media not only leverages the powerful psychological phenomenon of social proof to enhance online revenue but also offers innovative tools like augmented reality experiences and influencer affiliate programs.
Essential for any eCommerce website or online business, social media diminishes the risk of abandoned carts, accelerates the checkout process, and connects directly with Gen-Z and Millennials.
1. 25% of brands are selling directly on social media apps like Instagram Shops and TikTok Shop. (Hubspot)
2. 80% of social media marketers say consumers buy products directly within social apps more often than on brand websites or through third-party resellers. (Hubspot)
3. 55% of marketers say they have increased total retail sales through social media marketing. (Social Media Examiner)
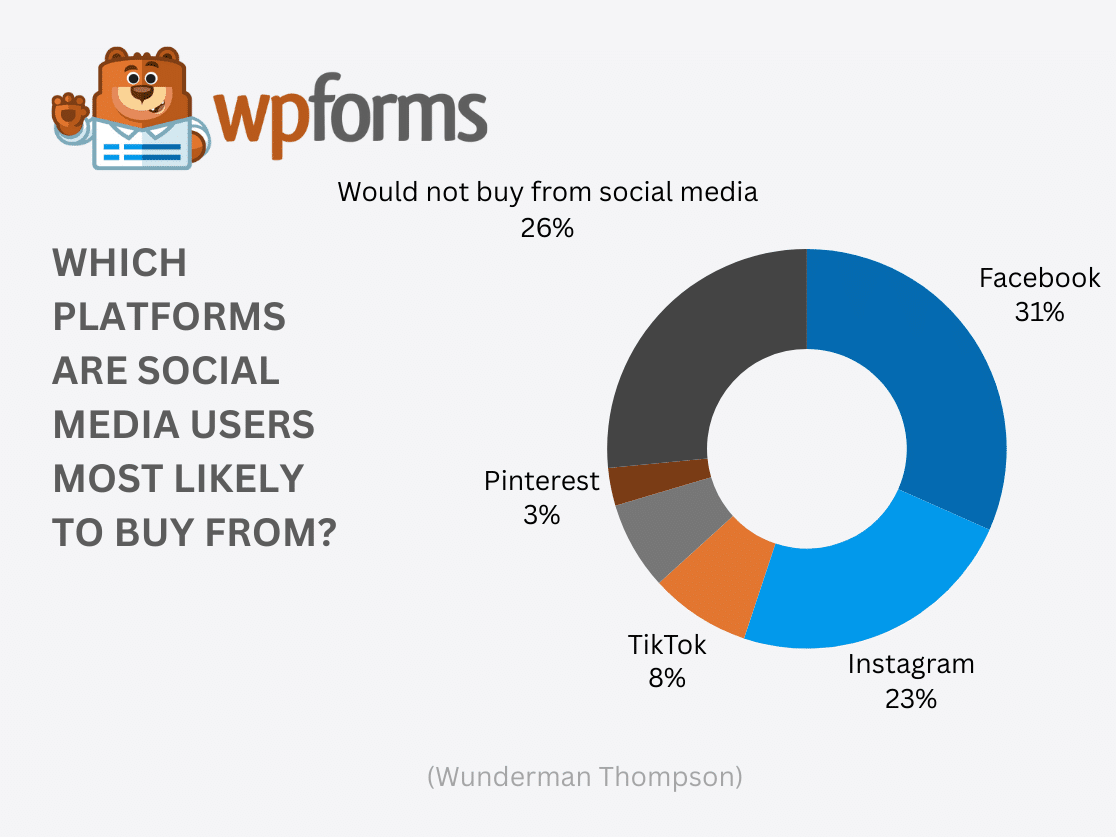
4. 31% of social media users search for products and services to buy online. (Hubspot)
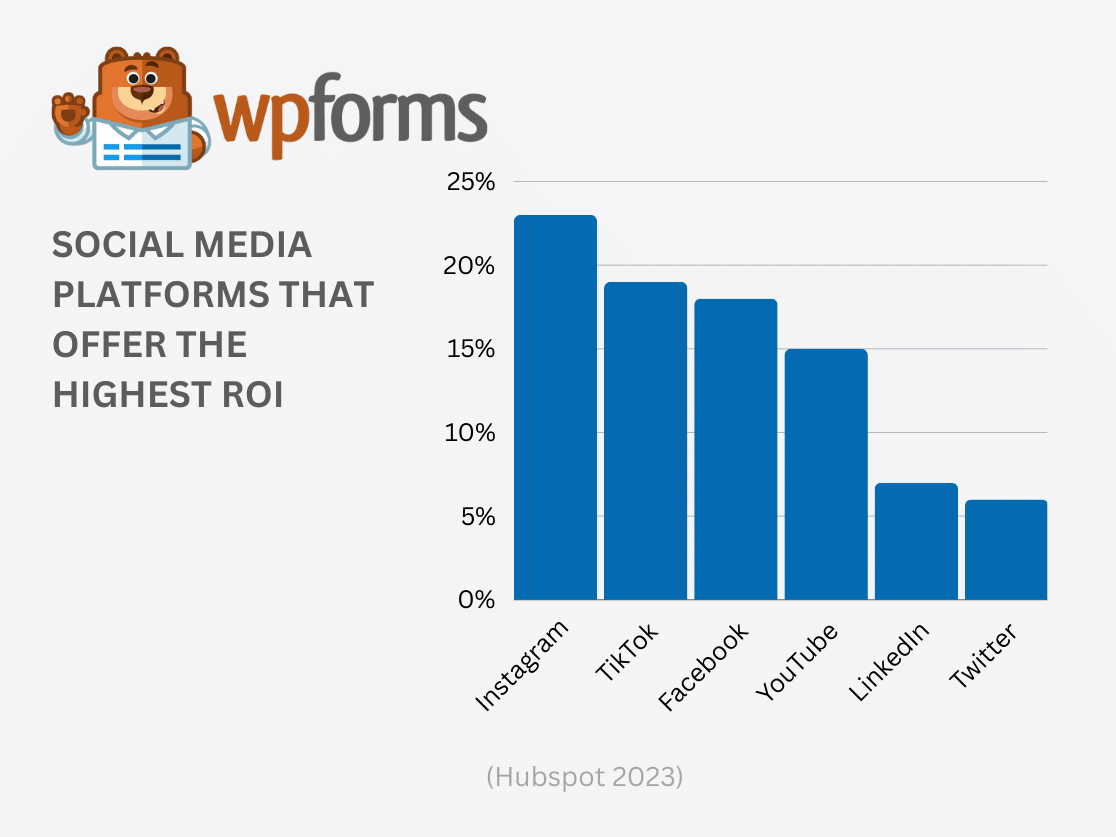
5. 33% of social media marketers agree Instagram offers the highest ROI when selling products directly in the app. (Hubspot)
6. 53% of Americans shop on social media platforms at least once per week. (Influencer Marketing Factory)
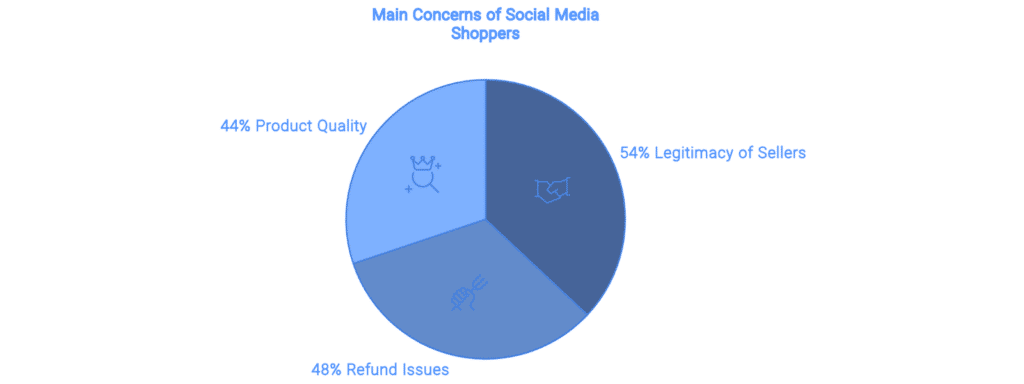
7. Social media users’ main concerns when shopping from an app are that sellers on social media aren’t legitimate companies (54%), that they won’t be able to get a refund (48), and concerns about the quality of the product (44%). (Hubspot)
8. 16% of brands currently use automation in sales funnel communications. (Ascend2)
9. 31% of online shoppers say Facebook is the platform they’re most likely to buy from. But 39% of Gen-Z shoppers say they’re most likely to buy from Instagram. (Wunderman Thompson)
10. 34% of marketers say Facebook generates the most sales. Instagram comes in second at 25%. (Social Media Examiner)
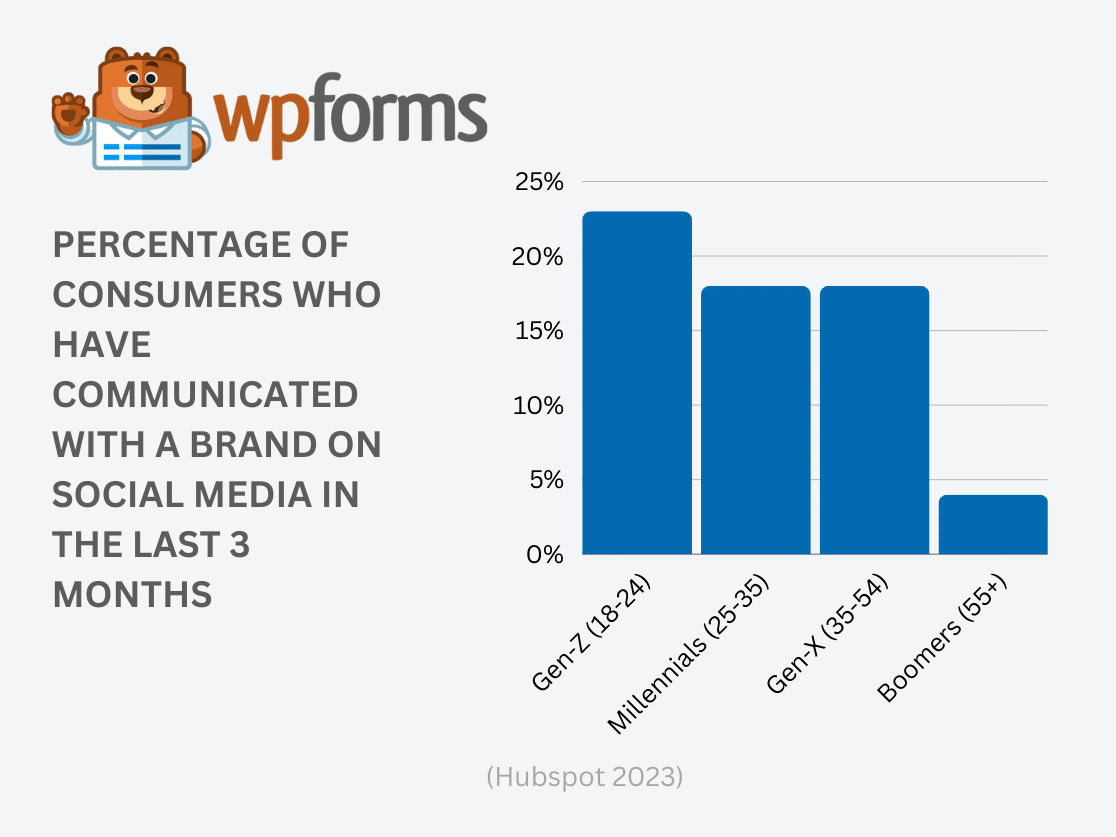
11. 28% of Gen-Z and millenial internet users have bought a product directly from social networks in the last three months. (Hubspot)
12. Livestream commerce is expected to be big in 2024, with 42% of Gen-Z social media users watching livestream video. (Insider Intelligence)
13. Livestream shopping is already popular in Asia, particularly in China, where it’s expected to reach 22% of eCommerce sales in the country in 2022. (eMarketer)
14. The livestream e-commerce market will reach approximately $50 billion by the end of 2023. (Influencer Marketing Factory)
15. Apparel, beauty products, and home products account for 60% of all social commerce purchases. (Influencer Marketing Factory)
16. The average U.S. social buyer will spend approximately $641 via social commerce channels in 2023. (Influencer Marketing Factory)
17. 89% of marketers who already use influencer marketing plan to keep up or increase their investment in the next 12 months. (Hubspot)
18. Half of all brands working with influencers have eCommerce stores. (Influencer Marketing Hub)
19. The global influencer marketing market size exceeds $21 billion. (Statista)
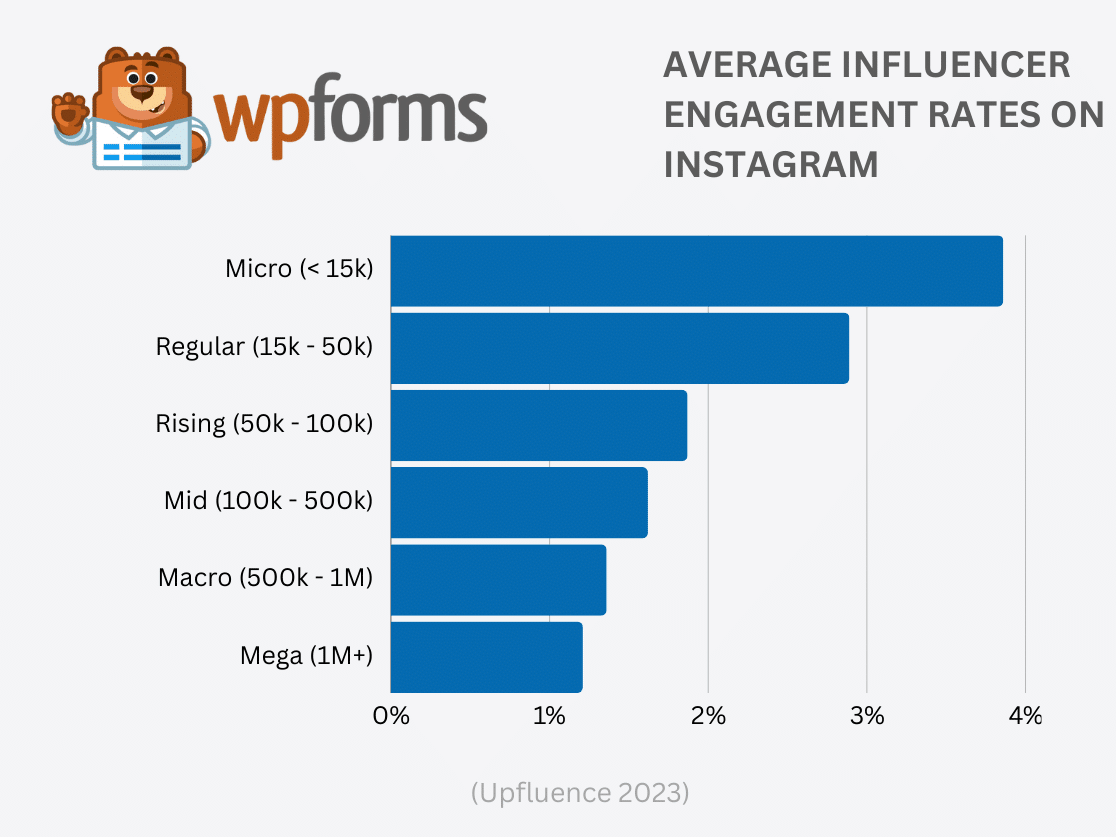
20. 55% of Gen-Z say that recommendations from influencers are the most important factor in their purchase decisions. (Hubspot)
21. 44% of consumers find new products by searching the internet, 36% discover them through social media, and 26% through YouTube ads. (Hubspot)
What Are the Most Important Mobile eCommerce Statistics?
As smartphones become ever more ingrained in our daily lives, the convenience of mobile shopping with just a few taps has transformed consumer habits and expectations.
Mobile eCommerce, or mCommerce, is not just a trend; it’s a shift in how retailers connect with their customers, offering unparalleled convenience, speed, and personalized experiences.
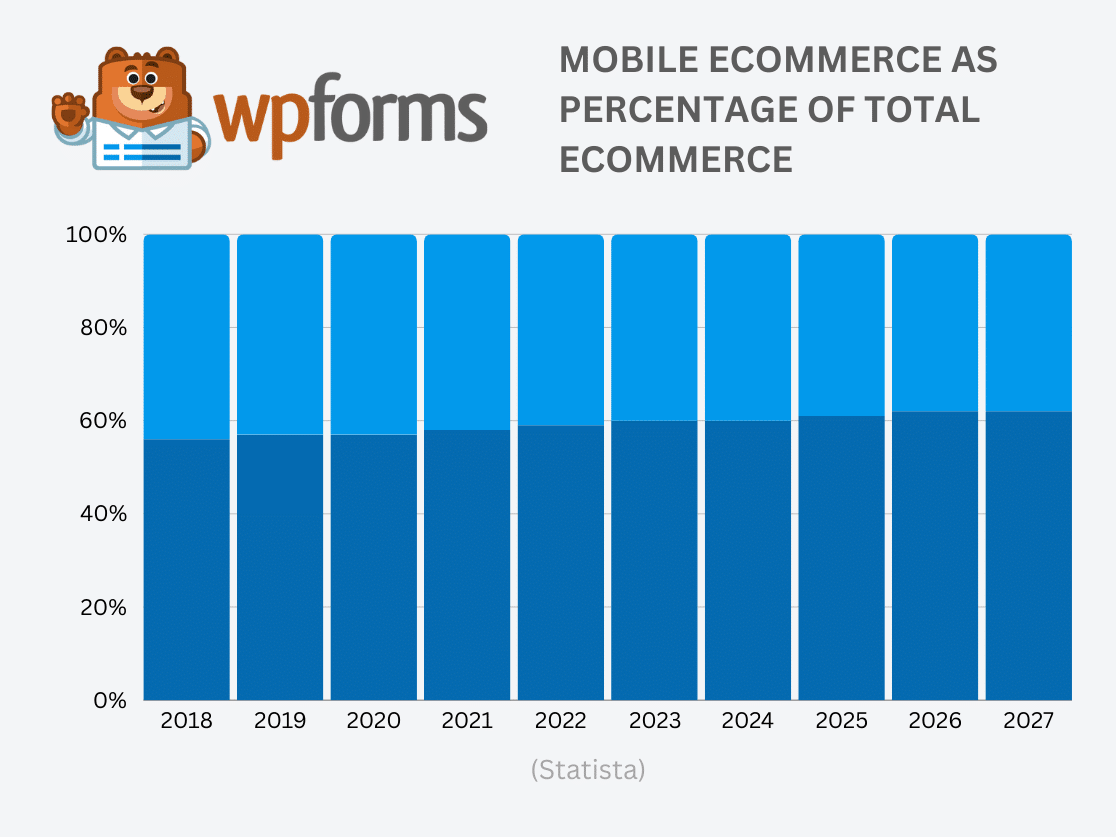
1. The mobile eCommerce market is worth $2.2 trillion and is expected to climb to 52% of the market by 2027. (Statista)
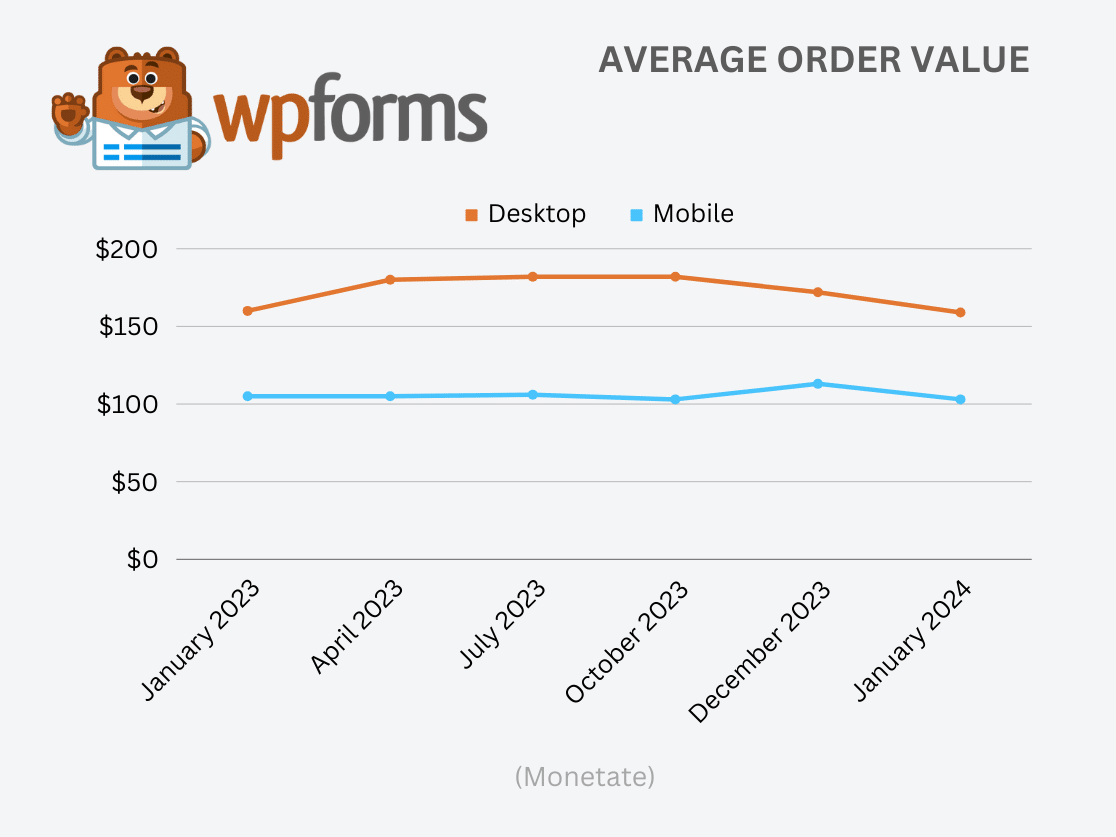
2. Average order value on mobile is lower than desktop at $90 – $110 compared to an average of $140-$175 on desktop, depending on the time of year. (Monetate)
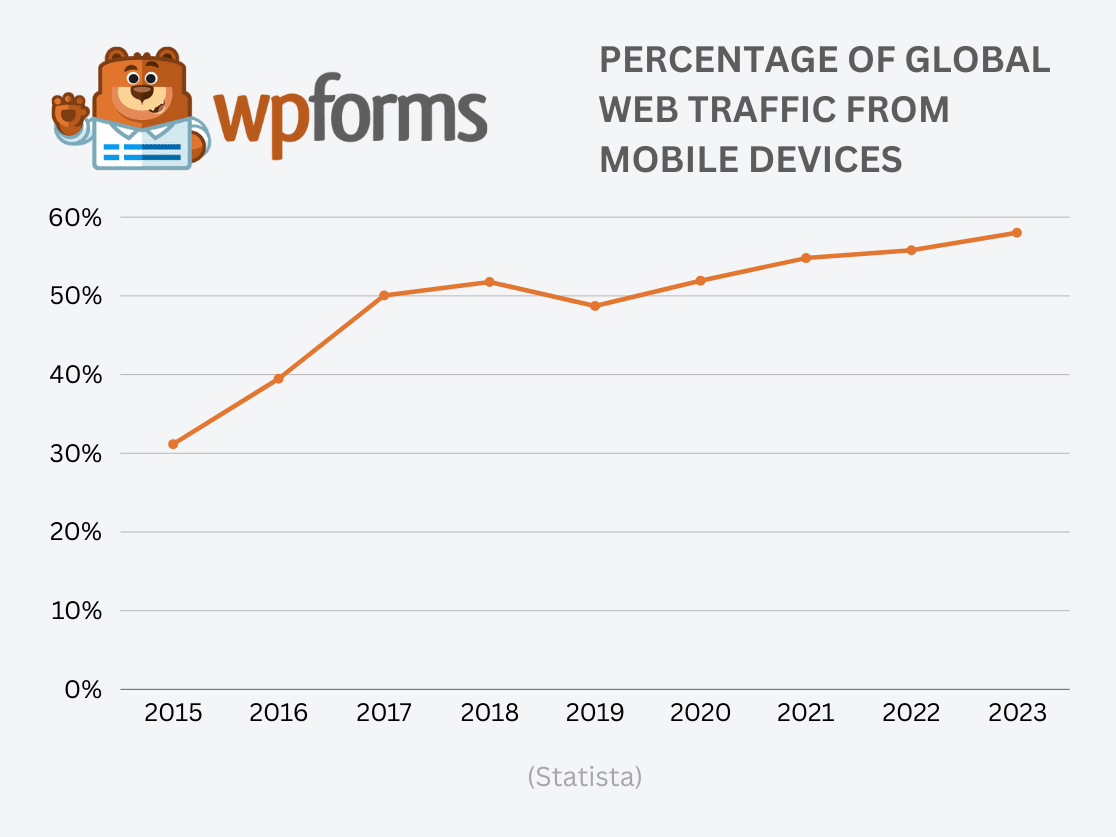
3. 68% of shoppers browse on mobile and 56% of online sales are completed on mobile websites and apps. (SaleCycle)
4. 29% of Americans purchase products or services on their smartphones at least once per week. (Vorhaus)
5. 71% of US adults use their mobile phone to buy products online. (ConsumerAffairs)
6. 88% of time spent on mobile devices is on apps and 70% of mobile sales are made via shopping apps. (BigCommerce)
7. 95% of young people aged 13-17 have a phone, demonstrating the powerful influence of mobile marketing and social media on the younger generation.. Most children get their first phone at the age of 11. (ConsumerAffairs)
8. 28% of US consumers use their phone during an in-store shopping trip to look up discounts and product information and compare prices between retailers. (PYMNTS)
9. 73% of consumers will switch from a poorly designed mobile site to one that makes purchasing easier.
10. Making CTA buttons (like a Click-To-Call button) can create a 45% boost in clicks.
11. One in every ten people who receive a text message clicks, resulting in a 16.9% increase in orders. (Omnisend)
12. Cart abandonment rate is higher on mobile devices, averaging 85.65%. (Hotjar)
What Can We Learn From Shopping Cart eCommerce Statistics?
The online shopping cart is where a lot of the action happens for your customers. It’s the last step before that purchase is finally made, and there are hundreds of reports with shopping cart eCommerce statistics since it’s such an important stage of your digital sales funnel. One theme in these stats is for sure — cart abandonment hurts your bottom line.
1. The average cart abandonment rate is 70.19% (Baymard Institute)
2. The biggest reason for shopping cart abandonment is extra costs such as shipping, taxes, and fees that are too high, with 47% of potential customers abandoning a cart for this reason. Other common reasons for abandonment include being forced to create an account (25%) and delivery that is too slow (24%). (Baymard Institute)
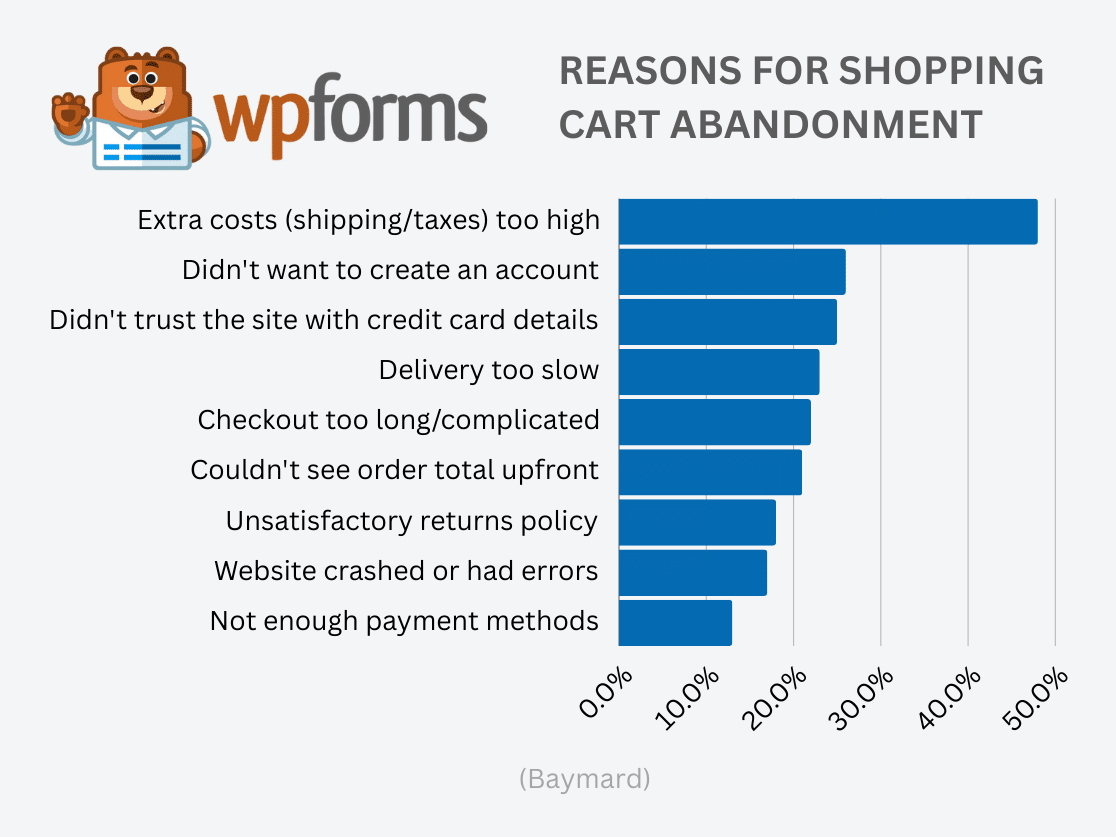
3. The average checkout form for online stores in the US has 23.48 form elements and one out of fiver shoppers has abandoned checkout due to the process being too long or complicated. (Baymard Institute)
4. $260 billion lost to shopping cart abandonment is recoverable through better checkout flow and design. (Baymard Institute)
5. Multi-step forms at checkout, or any other stage in the customer journey, convert up to 300% higher than one-page forms. (Venture Harbour)
6. Products that require frequent replenishment like groceries, cosmetics, and pharmaceuticals have the lowest cart abandonment rate (50-70%). Products that consumers spend longer thinking about buying have the highest cart abandonment rates such as home furnishings (90.5%) and automotive (85.97%). (Hotjar)
7. Traffic from organic search has the lowest average cart abandonment rate (76%), while traffic from social media has the highest (91%). (Hotjar)
8. Almost half of digital shoppers in the US (46%) have abandoned a shopping cart because a discount coupon code didn’t work. (Statista)
9. eCommerce sites can gain a 35% increase in conversion rates with an optimized checkout design. (Baymard Institute)
10. An estimated $4 trillion worth of products are left in digital shopping carts each year. (Drip)
11. Predictive AI can reduce cart abandonment by 18%. (Drip)
12. 26% of shoppers who abandon items in their carts go on to buy the same items from a different retailer. (Statista)
What Are the Most Important eCommerce Payment Statistics?
In the vast world of online shopping, how people pay for their purchases is hugely important. Keeping up with the latest eCommerce trends and payment statistics is essential for any business that wants to make buying as easy and secure as possible for their customers.
These statistics offer a look into the most preferred payment methods, the rise of new payment technologies, security issues, and how different ways of paying can affect shopper loyalty and trust.
1. Digital wallets like PayPal, Venmo, and Apple Pay are projected to rise to 52.5% of the value of online transactions in 2025. (World Pay Global)
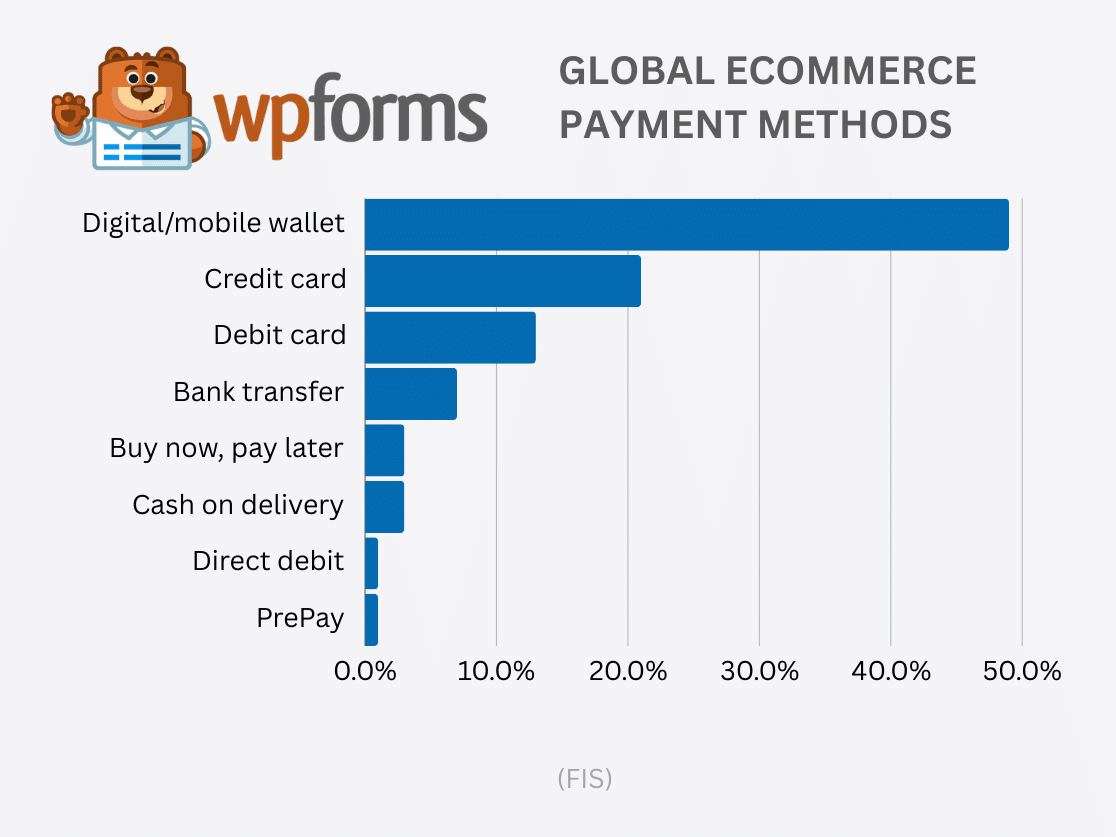
2. 45%, of mobile transactions take place using a mobile app. (Go Cardless)
3. The global buy now pay later (BNPL) market was worth 24.5 billion in 2022 and is expected to increase to 160.7 billion by 2032. (Yahoo! Finance)
4. In 2022, 5% of online purchases in the US were made with buy now pay later payment options. (Statista)
5. BNPL adoption is higher in Europe and usage is expected to reach 13.6% of European eCommerce spending by 2024. (Go Cardless)
6. One in five eCommerce companies offer a BNPL payment option. (Verifone)
7. North America has the highest fraudulent transaction value, accounting for over 42% of eCommerce fraud globally. (Mastercard).
8. 52% of eCommerce companies say payment method localization is their biggest challenge right now. (Verifone)
How Many eCommerce Sites Are There in 2024?
There are over 26 million online retailers across the entire globe, with more and more being created every single day. If these numbers make you think the eCommerce industry is a competitive market — don’t worry. Less than 1M of these sites sell more than $1,000/year, so there’s tons of room for growth.
And as building your own website becomes easier for everyone, having an eCommerce store is becoming a popular way for more people to make money online.
Alright, I’m Inspired to Grow My eCommerce Store! What’s Next?
Now that you can see just how successful eCommerce can be, it’s time to take your own store to the next level. Check out these Shopify alternatives.
You’ll also need a payment gateway to process orders from your eCommerce store customers. Check out our post on Stripe for WordPress to find the best plugin for payments.
Besides, all stores rely heavily on generating leads via contact forms and newsletters. WPForms Pro provides the best set of features to help grow your eCommerce store with forms because:
- It’s the easiest form builder for WordPress websites and provides2,000+ WordPress form templates to choose from, inclusing several pre-built order forms and payment forms to create a one-page checkout
- You can quickly create order forms in WordPress and embed them on your site without using any code
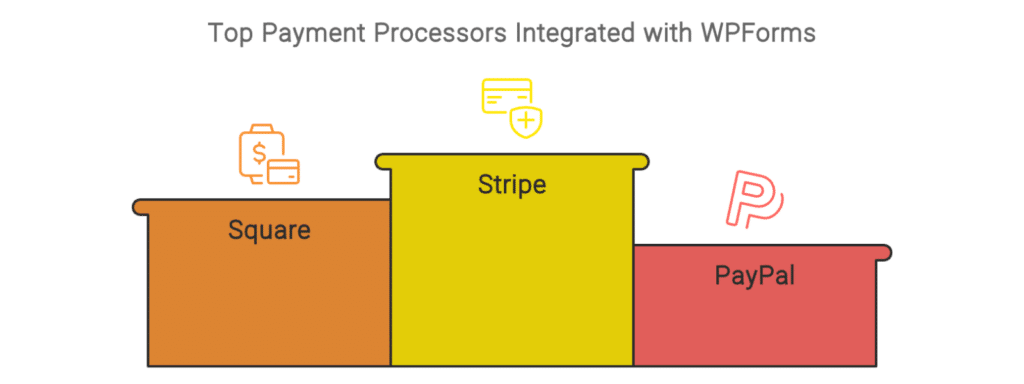
- WPForms makes it super easy to accept credit card payments on your WordPress site and it also integrates with Square payments, Stripe, and Paypal
- You can easily integrate with email marketing services like Mailchimp, AWeber, and Constant Contact to grow your mailing list and engage with customers
- The Calculations Addon brings your order forms to the next level by enabling automatic calculations based on user input
- You can easily create custom coupons and add a coupon field to your order forms to boost sales
- When you buy WPForms, you get access to priority support so you can get your order forms online fast
- You can even set up recurring payments in WordPress.
Click Here to Create Your Order Form Now
If you love staying on top of stats about online business, be sure to check out some of our other posts with useful statistics including:
- Mind-Blowing Digital Marketing Statistics
- The Ultimate List of Online Business Statistics
- Unbelievable Online Form Statistics & Facts
Ready to build your form? Get started today with the easiest WordPress form builder plugin. WPForms Pro includes lots of free templates and offers a 14-day money-back guarantee.
If this article helped you out, please follow us on Facebook and Twitter for more free WordPress tutorials and guides.

