Knowing online business statistics can help you grow your business online.
The type of content you publish for customers, the way people make online purchases, and how people search for information is constantly changing. That’s why staying up to date on the latest trends and stats is so crucial to your success.
In this article, we’ve compiled a detailed list of online business statistics for you so you don’t have to look all over the place for the data you need. All these statistics are taken from reports and studies published in the last few years.
Online Business Statistics
Now, let’s check out this amazing roundup of online business stats and facts!
In This Article
- Internet – Stats and Facts
- Online Businesses – Statistics and Facts
- Lead Generation – Facts and Stats
- Content Marketing and Blogging – Stats and Facts
- Video Marketing – Facts and Statistics
- Email Marketing – Statistics and Facts
- Social Media – Stats and Facts
- The Use of AI in Online Business – Statistics and Facts
Internet – Stats and Facts
When we talk about the internet, we’re really talking about where your customers are spending a big chunk of their time.
Understanding the numbers behind it all like how many people are online shopping, which social media platforms are hot right now, and whether they’re browsing on their phones or desktops is crucial for planning your online strategy.
So let’s take a look at some stats on internet use compiled from the most up-to-date studies: what’s trending, what’s on the way out, and where you might find your next big opportunity.
1. As of 2023, the total number of internet users around the globe reached 5.3 billion, accounting for 65.7% of the global population. (Statista)
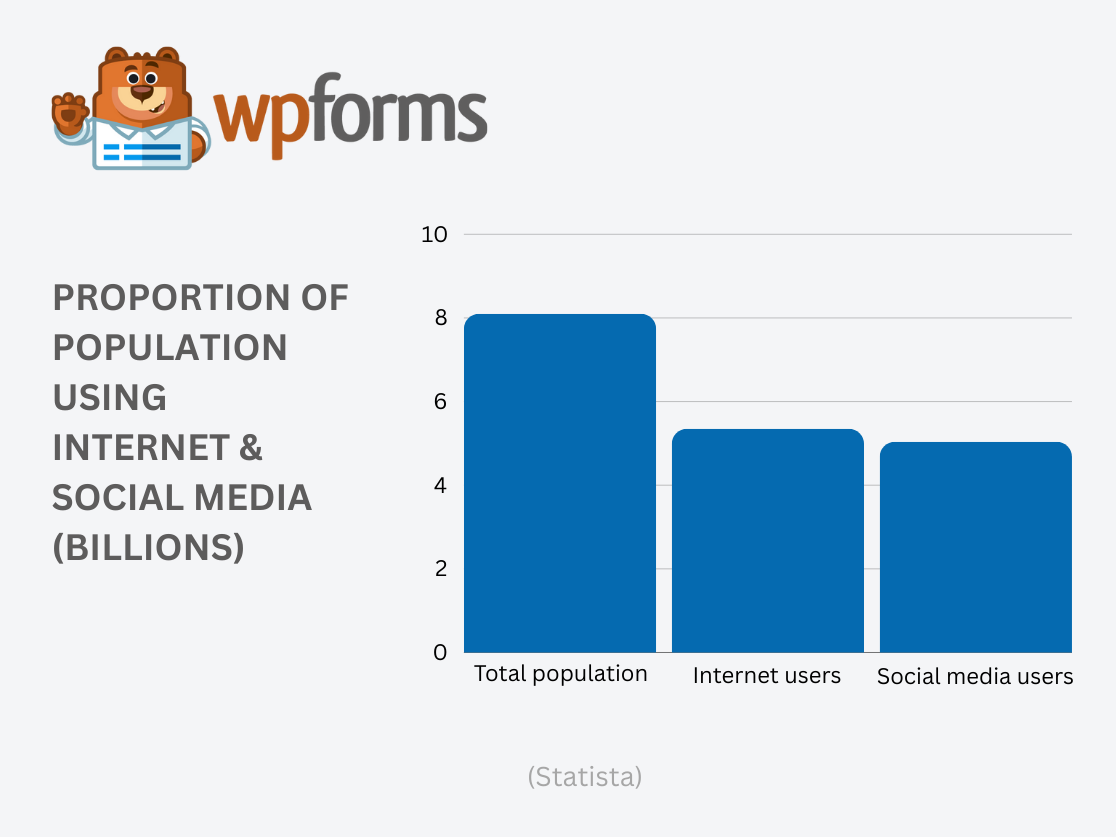
2. The highest percentage of internet users is in Northern Europe, with 97.3% of the population online, followed by 92% in Northern America and 79.5% in Oceania. In Asia, the percentage varies between 71% and 76%, while the lowest internet penetration is observed in Central Africa (24-48%) and Southern Asia (51.5%). The worldwide average internet penetration rate stands at 65.7%. (Statista)
3. China has the largest number of internet users of any country, totaling 1.05 billion. India is second with 692 million users, and the United States ranks third with 311.3 million internet users. (Statista)
4. There are 1.13 billion websites globally, of which 200 million are active. (Forbes)
5. Google processes 99,000 searches every second, which translates to 8.5 billion searches per day and approximately 2 trillion searches each year. (SEO.ai)
6. Google is the most visited website in the world, receiving 117.8 billion monthly visits. YouTube is the second most visited site with 117.3 billion visits, followed by Facebook with 18.7 billion visits. Other popular websites in the top 10 include X/Twitter, Wikipedia, Instagram, Reddit, Duck Duck Go, Amazon, and Yahoo. (Exploding Topics)
7. Chrome is the leading web browser with a 64.7% market share, while Safari is second at 18.59% and Edge is third at 4.96%. (Statcounter)
8. Google dominates the search engine market with a 91.6% share, followed by Bing at 3.4% and Yandex at 1.7%. (Statcounter)
9. WordPress powers 43.1% of all websites and holds a 62.9% market share in the content management system sector. (W3Techs)
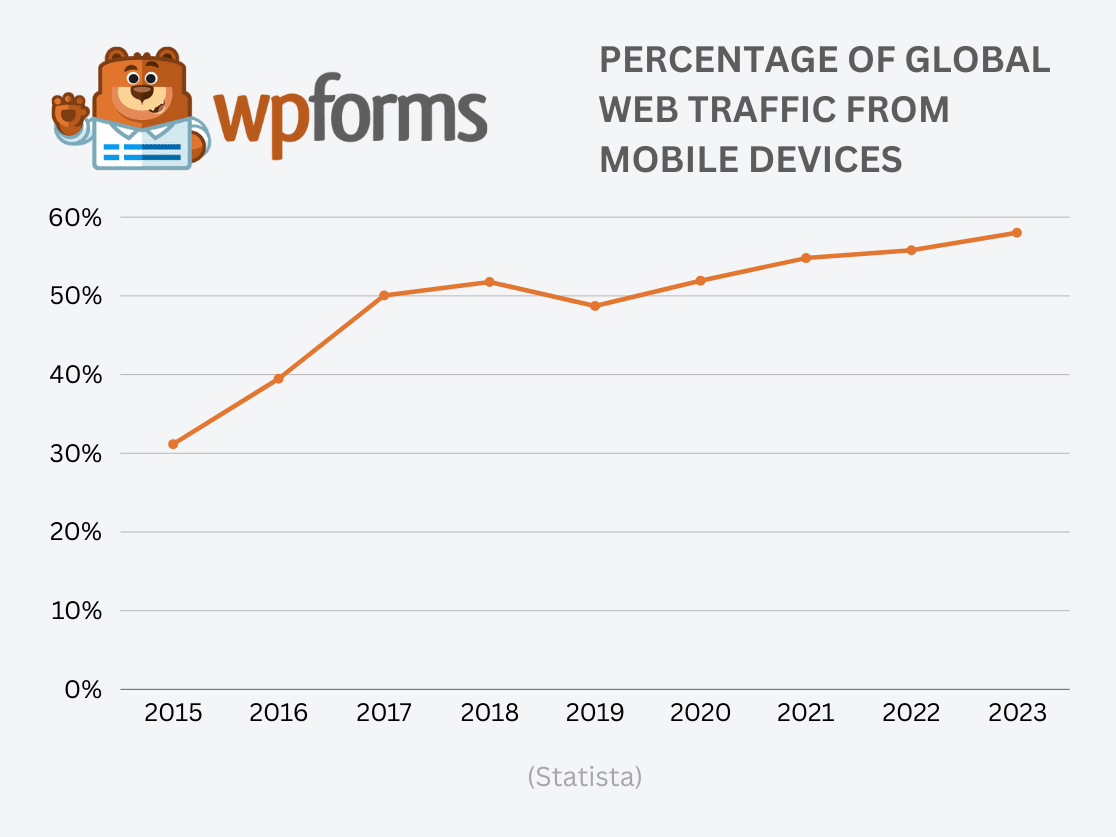
10. A significant 95.8% of internet users access the internet via mobile phones, and 62.9% use laptops. (Statista)
11. Following WordPress, the next most popular content management systems are Shopify with a 5.8% market share, Wix at 3.65%, Squarespace at 2.1%, Joomla at 1.85%, Drupal at 1.2%, GoDaddy at 0.4%, and Weebly also at 0.4%. (Statista)
12. The most popular social media platforms include Facebook with 3.03 billion active users, YouTube with 2.49 billion, Instagram with 2 billion, and TikTok with 1.22 billion. (Statista)
13. The average internet user spends 6 hours and 58 minutes online each day. (Data Reportal)
14. The average household in the United States has 7.1 smart devices. (Telecompetitor)
15. Globally, there are over 125 million active users of voice assistants. (Tech Report)
16. In the United States, 36.6% of residents regularly use a voice assistant. (Tech Report)
17. The largest demographic group of internet users is the 25-34 year olds, who make up 33.8% of internet users worldwide. (Statista)
17. Websites with .com domains are over 33% more memorable than those with other top-level domains. (Growth Badger)
Online Businesses – Statistics and Facts
Knowing how people engage with their favorite brands and what influences them to buy are the keys to growing a successful online business. That’s why we’ve gathered some of the most compelling online business and eCommerce stats and facts around.
1. About 7 out of 10 small businesses now have their own websites. (Top Design Firms)
2. Almost 3 in 10 small business owners think that setting up a website is just too expensive. (Moneyzine)
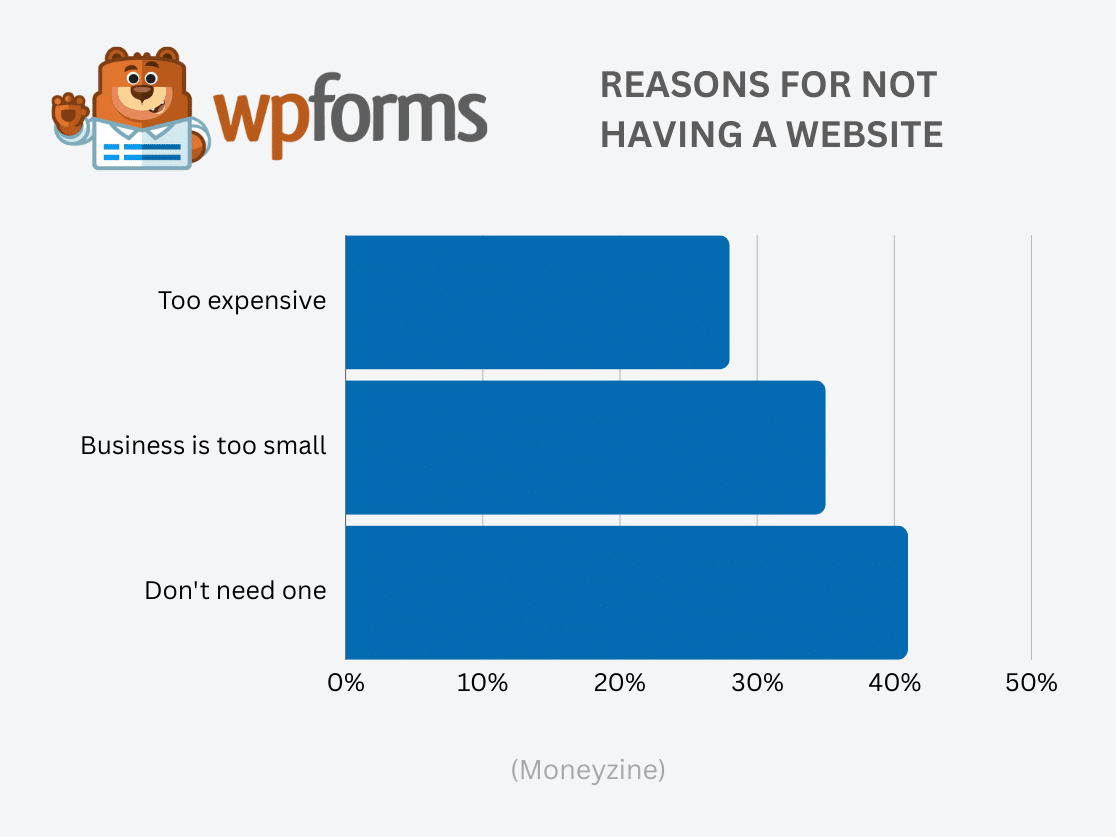
3. A good 35% of small businesses without a website feel they’re just too small to need one. (Moneyzine)
4. The majority of Gen-Z and Millennials, around 60%, are more inclined to buy products made by small businesses. (Hubspot)
5. Three-quarters of consumers make it a point to check out a business online before visiting in person. (Visual Objects)
6. A third of online shoppers enjoy browsing and ‘window shopping’ online just for fun. (Visual Objects)
7. A whopping 82% of consumers want the brands they buy from to share their personal values. (Consumer Goods Technology)
8. When people shop online using a computer, they tend to spend about $155.75 on average, but this drops to just over $112 on mobile. (Tidio)
9. 56% of consumers prefer online shopping because it’s always available, day or night. (Statista)
10. 27% of people worldwide regularly shop online. (Tidio)
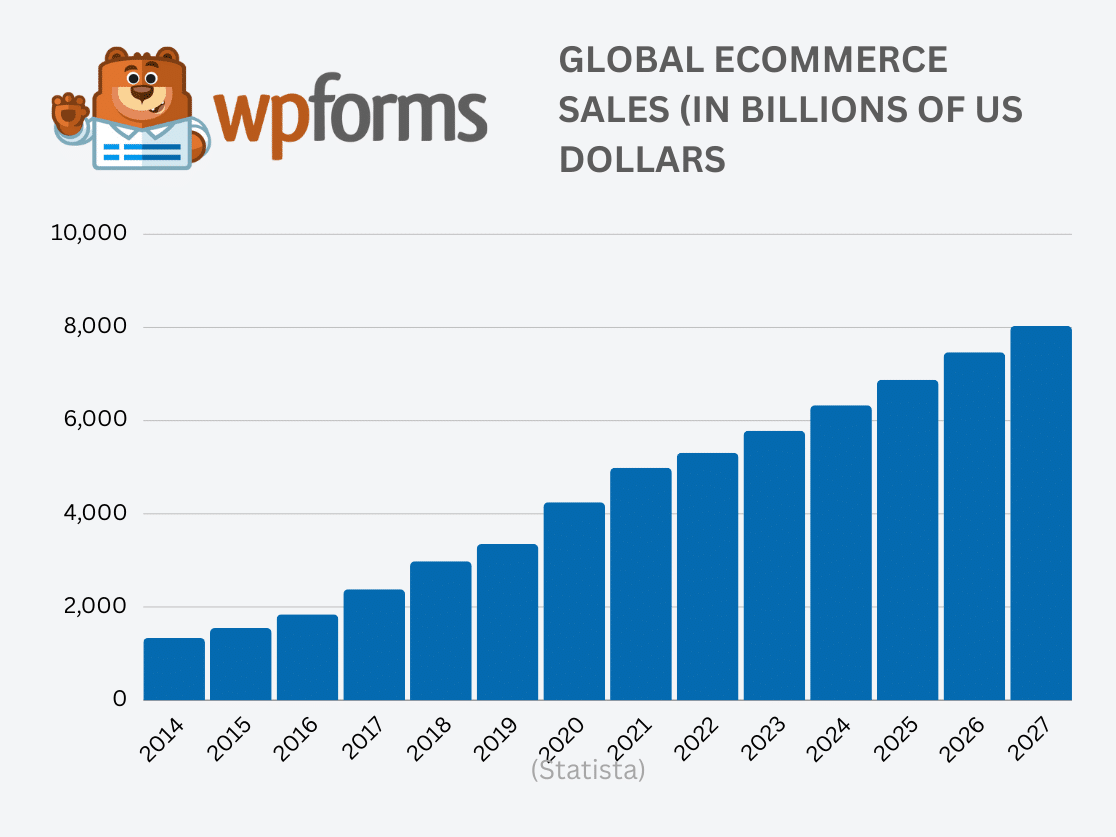
11. The global eCommerce market is expected to explode, reaching over $8 trillion by 2027. (Statista)
12. The average cart abandonment rate across all industries is 69.89%. (Baymard Institute)
13. Amazon is leading the pack in the eCommerce world, getting more than 13% of all desktop traffic, four times more than eBay. (Statista)
14. November is the ultimate shopping month, with sales skyrocketing 12% to 140% more than in other months, thanks to Black Friday and Cyber Monday. Interestingly, online sales hit their lowest in the summer. (SaleCycle)
15. Almost half of all consumers, about 49%, trust online reviews as much as they trust recommendations from their friends and family. (Brightlocal)
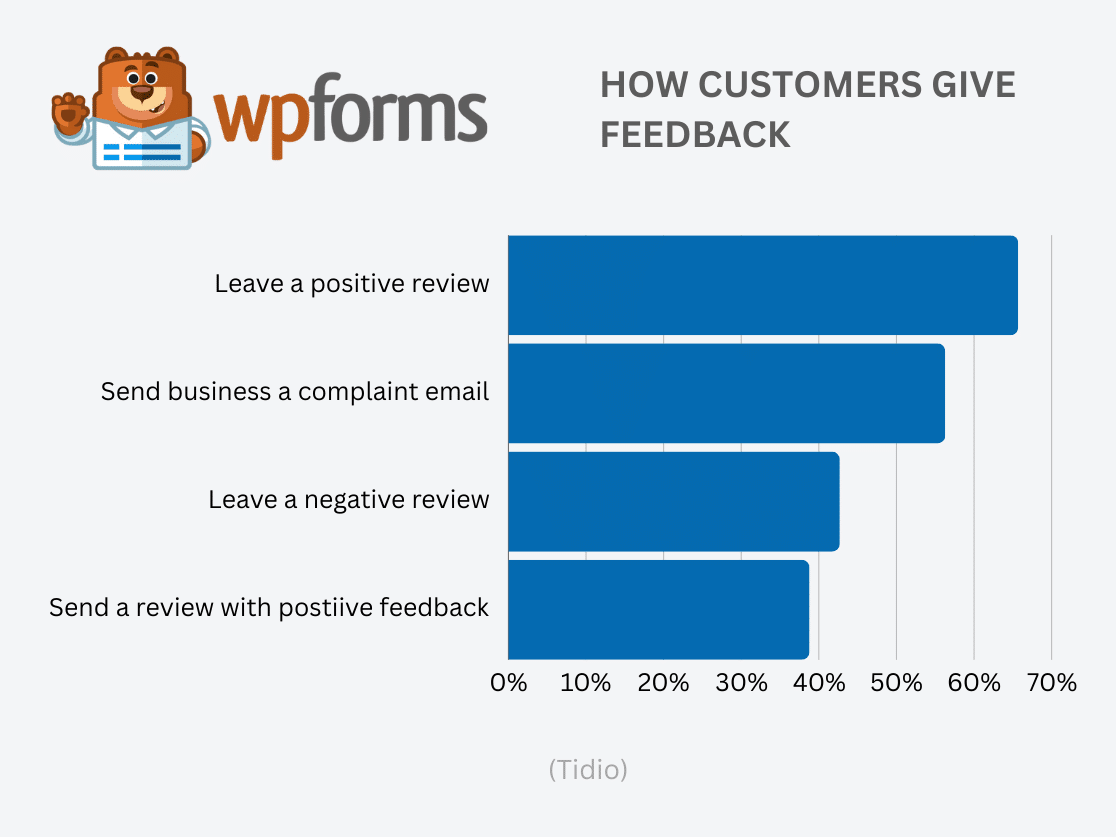
16. It’s expected that eCommerce sales will grow by 10.1% each year, way faster than in-store sales, which are only looking at a 2% growth. (eMarketer)
17. By 2040, it’s estimated that a staggering 95% of all purchases will likely be made online. (Instapage)
18. In the past year, 71% of consumers have switched brands at least once, showing a notable shift in consumer loyalty. (Salesforce)
19. Displaying customer reviews on their websites can help brands increase their conversion rates by as much as 20%. (Power Reviews)
20. Want to start your online business? Use the free business name generator tool by WPBeginner to come up with catchy company name ideas and get started.
Lead Generation – Facts and Stats
Over half of all businesses claim that generating leads and traffic to their site is their biggest marketing challenge. If this is something you struggle with, read up on these important facts and statistics to see where you can make improvements.
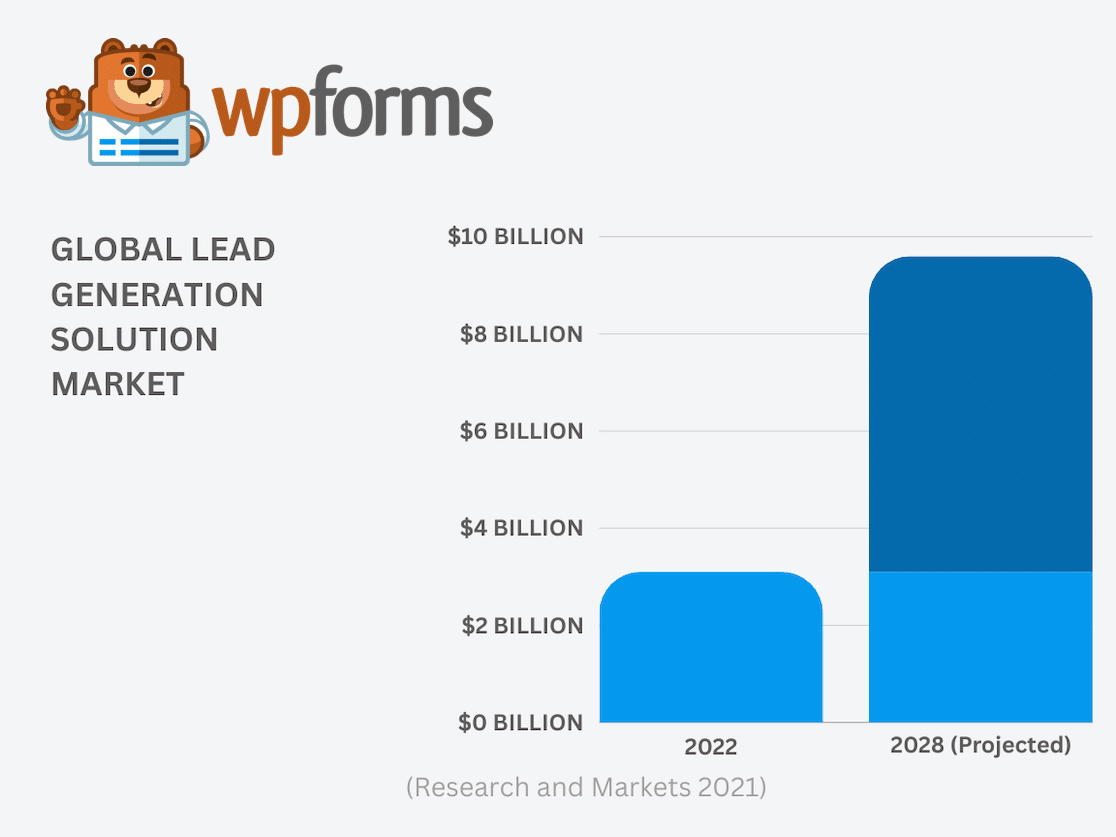
1. The global lead generation market is poised for growth, expanding from $3,103.8 million in 2021 to an expected $9,589.1 million by 2028. (Research and Markets)
2. A staggering 91% of marketers highlight lead generation as their top priority. (Ruler Analytics)
3. Multi-step forms in WordPress can lead to 300% more conversions. (Venture Harbour)
4. For 27% of marketers, lead generation stands as a key metric to assess their content marketing strategy’s effectiveness. (Hubspot)
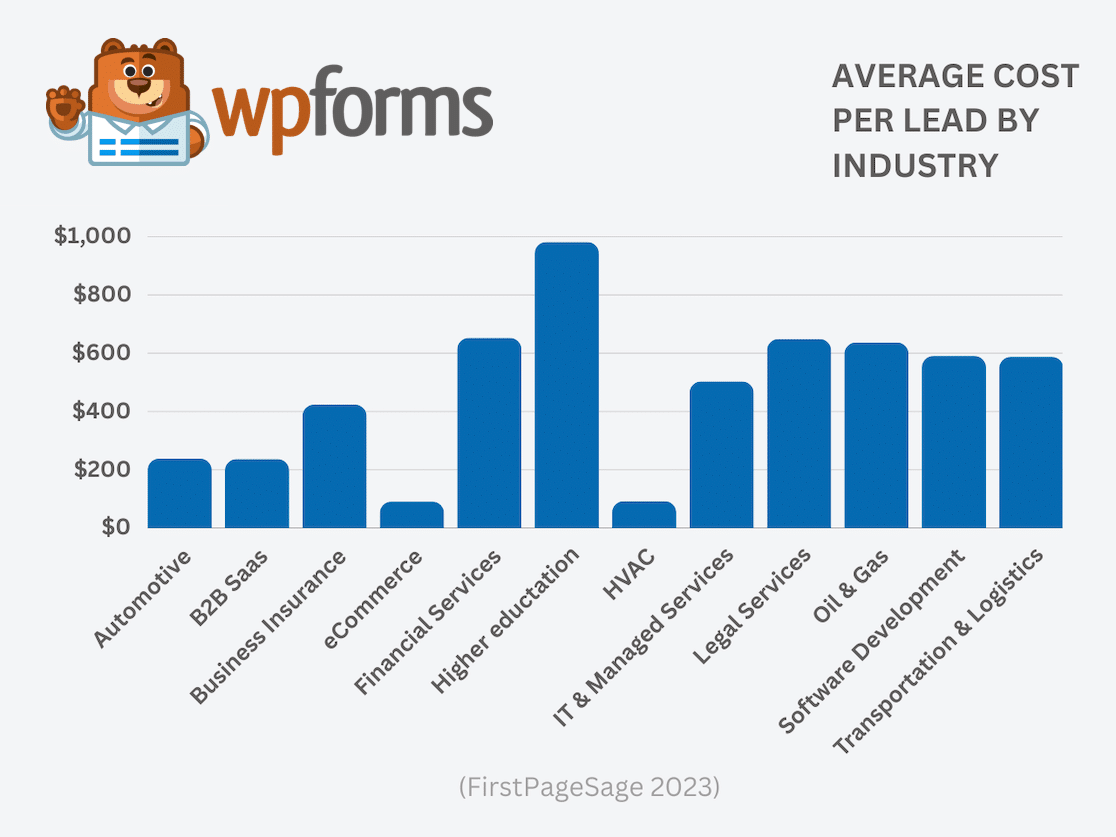
5. The average cost per lead varies across industries, with higher education coming out on top, averaging $984 per lead. Other industries with a high average cost per lead include financial and legal services, oil & gas, IT, software development, and transport & logistics. The eCommerce and HVAC industries are at the lower end, averaging around $91 and $92 per lead, respectively. (FirstPageSage)
6. Over half of all marketers, about 53%, allocate at least half of their marketing budget to lead generation. (BrightTALK)
7. In 2023, web conversions increased by nearly 11% on average, while inbound leads saw a 6.66% rise. (Hubspot)
8. The highest conversion rates for search ads are seen in industries including pets (13.41%), physicians and surgeons (13.12%), and automotive (12.61%). (Wordstream)
9. Around 65% of high-intent searches (those with purchase intent) result in an ad click. (Optiminder)
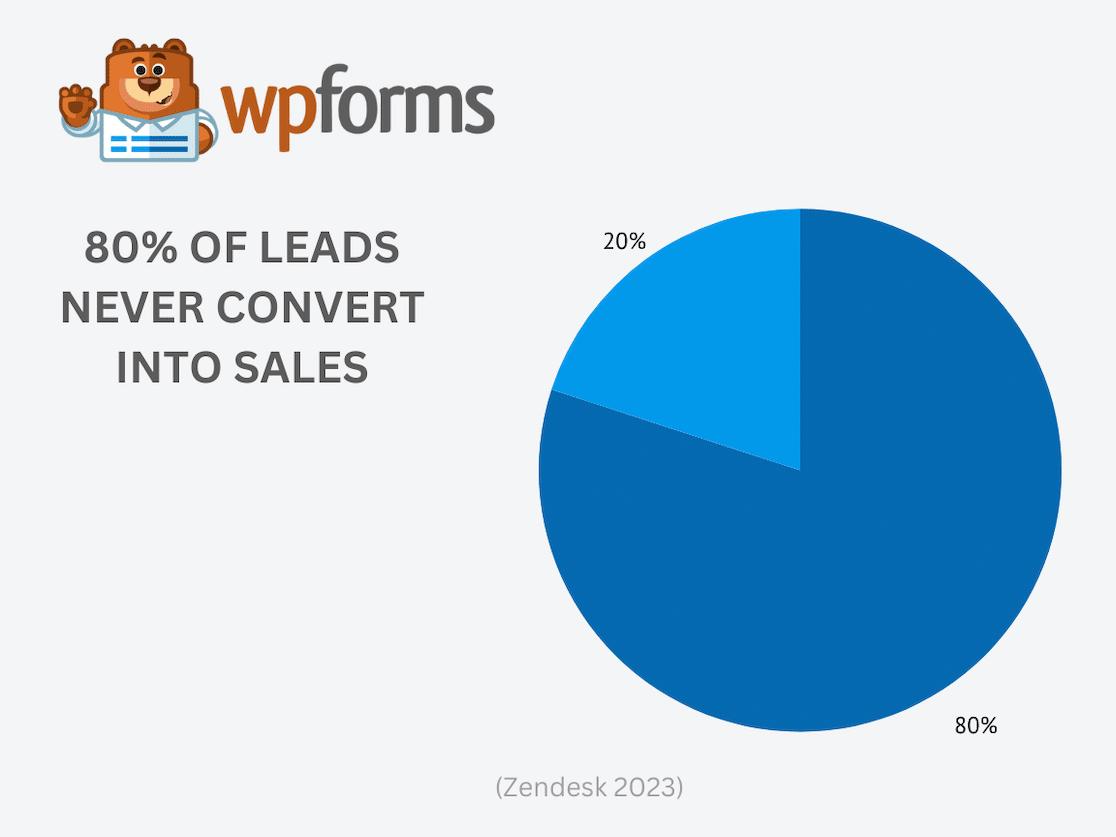
10. 80% of new leads never convert into sales (Zendesk)
11. Global spending on search advertising is forecasted to surpass $306 billion in 2024. (Statista)
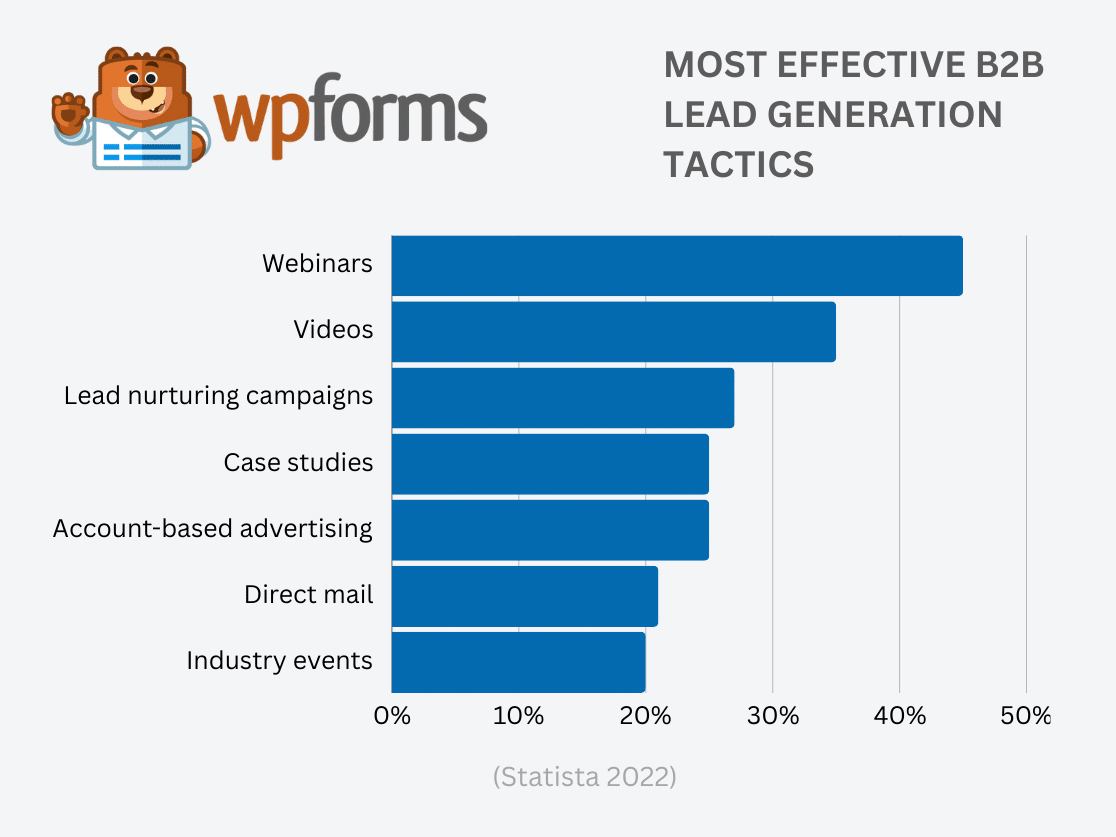
12. 45% of B2B marketers find webinars to be the most effective for top-of-the-funnel demand generation, followed by virtual events and digital experiences at 35%. (Statista)
13. More than 35% of B2B marketers cite a lack of understanding of their offerings as a significant lead generation challenge. A niche or hard-to-reach audience, difficulty reaching decision makers, the audience not knowing the product or service, and unscalable outreach efforts are also cited as difficult factors. (Statista)
14. LinkedIn is the go-to platform for 84% of B2B marketers for lead generation. (Social Media Examiner)
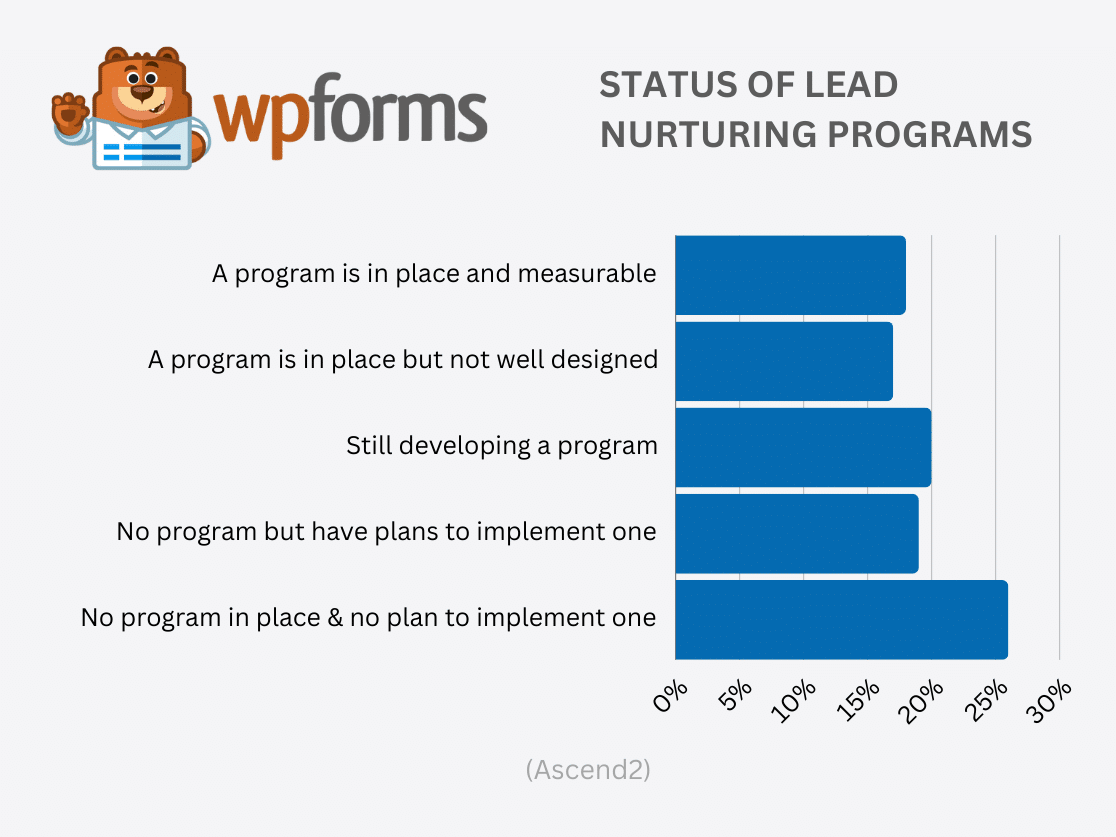
15. Effective lead nurturing strategies can result in 50% more sales-ready leads at a 33% lower cost. (Adobe)
16. Personalizing marketing efforts can cut customer acquisition costs by up to 50%. (McKinsey & Company)
17. 60% of senior executives believe that AI will greatly influence lead identification in sales and marketing. (McKinsey & Company)
18. Enterprises employing AI for lead generation have observed a 15-20% increase in sales productivity. (SalesFuse)
19. 40% of businesses are either planning to or have already increased their AI investment for lead generation. (Salesforce)
Content Marketing and Blogging – Stats and Facts
Imagine if every time you talked about your business, your customers not only listened but were genuinely excited to hear more. That’s the magic of content marketing. It’s not just about bombarding your audience with ads; it’s about creating valuable content that educates, entertains, and engages people.
Whether it’s through insightful blog posts, captivating videos, helpful how-tos, or engaging social media content, content marketing helps you build a relationship with your audience.
So let’s explore the statistics that highlight why content marketing is not just a trend, but a fundamental shift in how businesses reach and engage with their customers.
1. Nearly 70% of online experiences start with a search engine. (BrightEdge)
2. Approximately 29% of marketers utilize search-optimized websites and blogs for attracting and converting leads. (Hubspot)
3. Small businesses with blogs generate 67% more leads on average than companies without blogs. (Demand Metric)
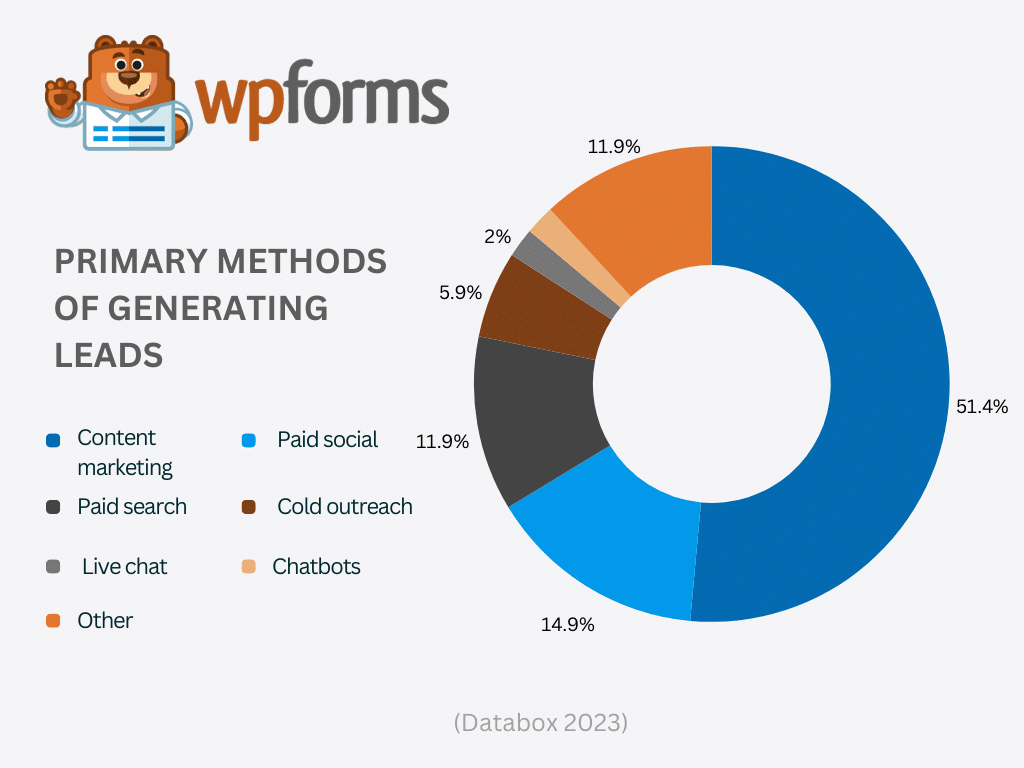
4. Over half of all lead acquisition methods are attributed to content marketing, with over 70% of industry professionals believing blogging has become more effective in generating leads (Databox)
5. 70 million new posts are published on WordPress each month. (OptinMonster)
6. For 43% of marketers, the major challenge in lead nurturing is crafting engaging, targeted content. (Ascend2)
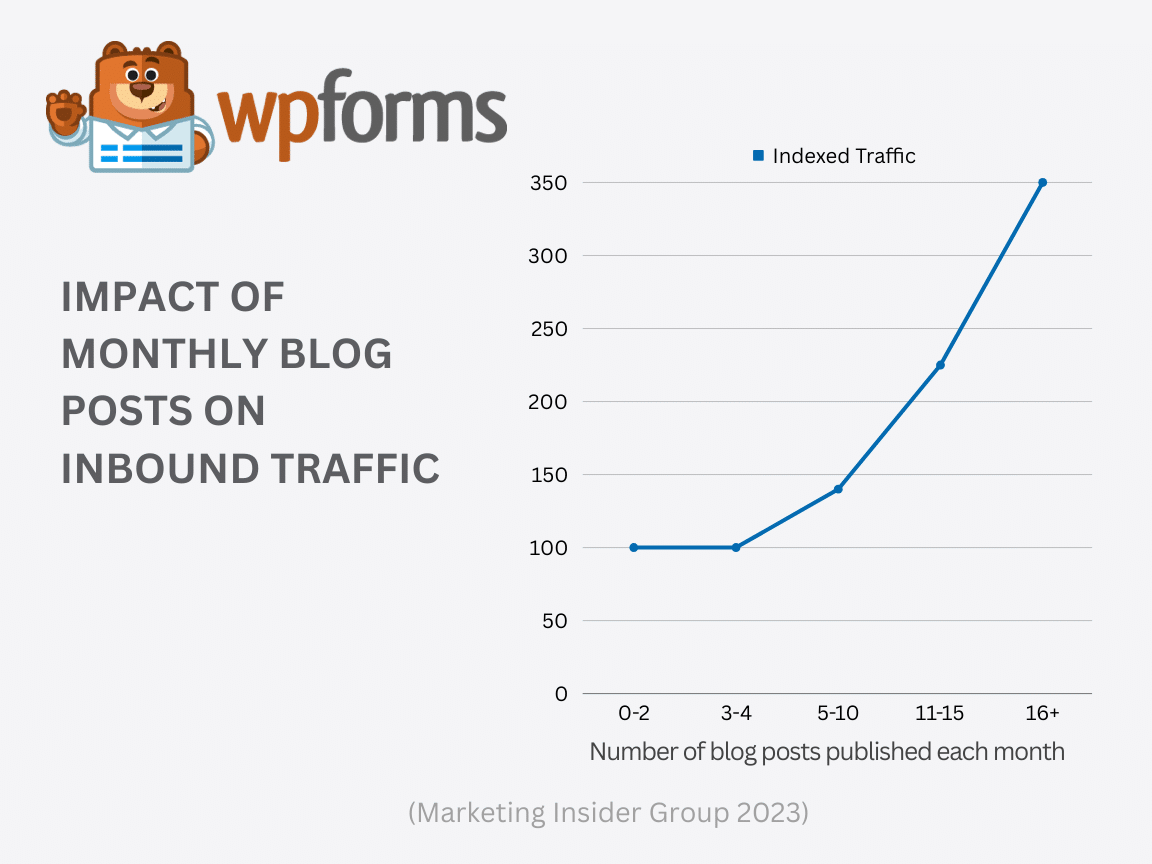
7. Organizations with at least 400 blog posts obtain more than 3.5 times the leads than those with fewer than 100 posts. (Marketing Insider Group)
8. 51% of companies find that updating old content is the most efficient content marketing strategy. (G2)
9. 55% of marketers agree that increased content publication leads to higher organic search rankings. (SEMRush)
10. Revising and republishing old blog posts with fresh content and images can more than double organic traffic. (Backlinko)
11. Close to 80% of brands employ content for lead generation. (Adobe)
12. B2B marketers using content for lead generation stands at 85%, compared to 60% among B2C marketers. (Exploding Topics)
13. The average website loading time is 2.5 seconds on desktops and 8.6 seconds on mobile devices. (Tooltester)
14. The typical length of a blog post is around 1,416 words. (OptinMonster)
15, Writing a blog post generally takes about 4 hours. (OptinMonster)
16. A majority of marketers (83%) believe in the effectiveness of creating high-quality content rather than publishing lower-quality content more often. (Hubspot)
17. Websites featuring blogs attract 55% more visitors. (Quick Sprout)
18. More than 4.4 million blog posts are published each day. (Tech Jury)
19. Websites with active blogs generate 97% more backlinks than those without a blog. (Business 2 Community)
20. 94% of blog posts never earn any external links. (Backlinko)
21. The top position in Google’s organic search results has an average click-through rate (CTR) of 27.6%. (Backlinko)
Video Marketing – Facts and Statistics
Digital marketing is always on the move, constantly adapting and changing. Right now, video content is not just going along for the ride; it’s steering the ship.
YouTube, standing as the world’s second-largest search engine, serves as a powerful testament to our collective love for videos. Whether it’s for entertainment, learning, or getting the scoop on brands, products, and services, people are increasingly turning to video content.
Stay tuned as we dive into some of the most eye-opening video marketing statistics from recent years, showcasing why video has become an indispensable tool in the digital marketer’s toolkit.
1. In 2023, an impressive 91% of businesses leveraged video for marketing. (OptinMonster)
2. Almost 60% of marketers are planning to increase their YouTube activities in the coming year. (Social Media Examiner)
3. A whopping 90% of marketers committed to short-form video in 2023 are planning to either increase their investment or keep it steady in 2024. (Hubspot)
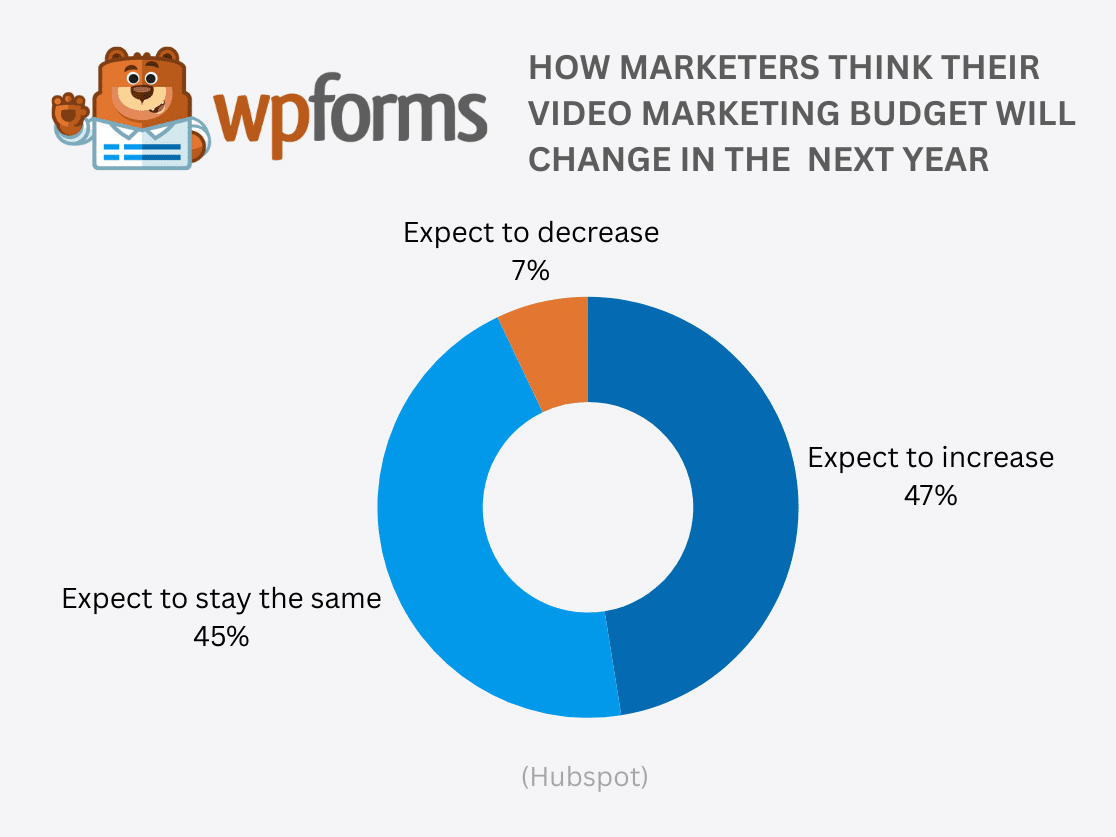
4. 86% of marketers have found that video marketing is effective for driving more traffic to their websites. (Wyzowl)
5. A quarter of marketers believe that videos yield the highest return on investment compared to other content formats. (Hubspot)
6. Videos make up 10% of all search engine results pages, showing their growing online presence. (Backlinko)
7. An astounding 500 hours of video content are uploaded to YouTube every single minute. (Statista)
8. Live streaming has overtaken cable and broadcast, now accounting for 38.1% of total TV usage. (Exploding Topics)
9. A significant 70% of all YouTube watch time happens on mobile devices. (YouTube)
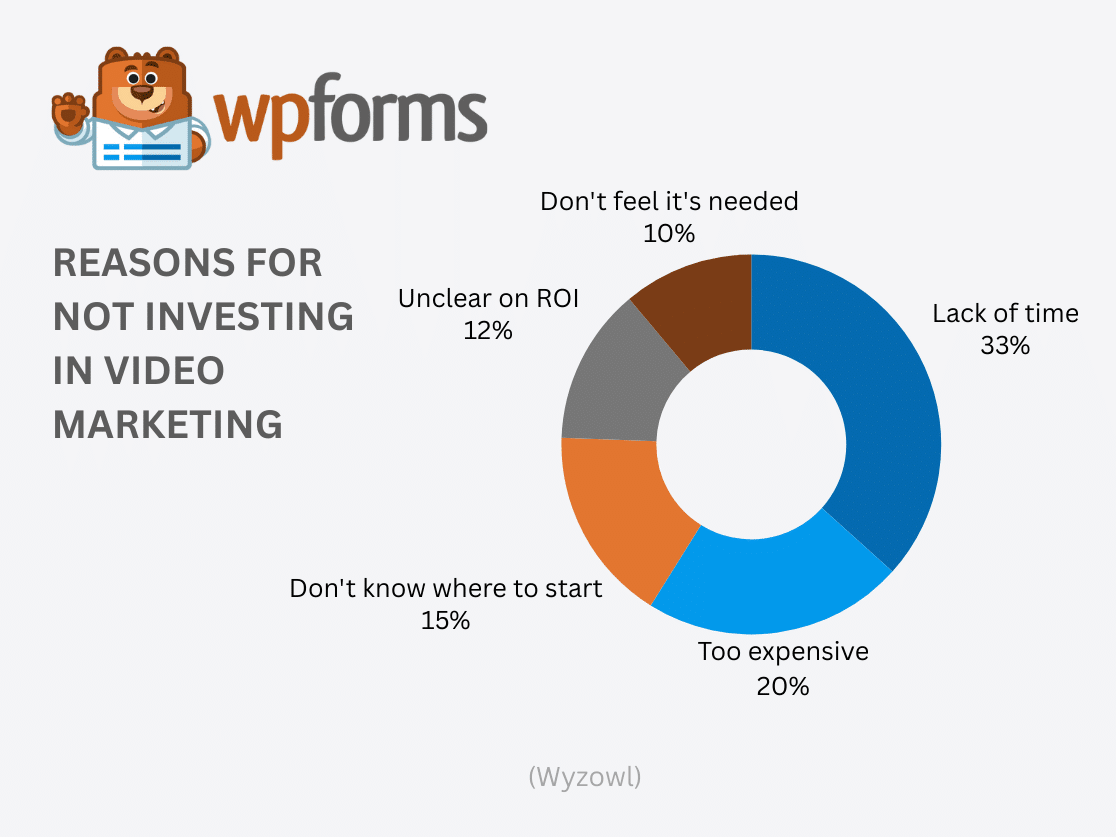
10. A third of marketers not using video cite lack of time as the reason, while 20% find it too costly and 15% are unsure where to start. (Wyzowl)
11. 39% of video marketers have created video testimonials, making it the top use for video marketing in 2024. Explainer and social media videos follow closely behind. (Wyzowl)
12. Three-quarters of video marketers have utilized AI tools for creating or editing their marketing videos. (Wyzowl)
13. An overwhelming 90% of marketers report that video marketing has provided them with strong ROI. (Wyzowl)
14. Two-thirds of consumers (66%) say they pay most attention to short-form videos. (Sprout Social)
15. A striking 95% of marketers using video marketing report an increase in brand awareness. (OptinMonster)
16. Creating a video landing page has the potential to increase conversions by as much as 80%. (Sales Lion)
Email Marketing – Statistics and Facts
Email marketing services are a great way to generate leads, nurture relationships with new subscribers and existing customers, and promote your business to people long after they leave your website.
Take a look at these exciting email marketing statistics and facts and discover where you can make changes in your own strategies.
1. At the close of 2022, there were 4.26 billion email users, a number expected to soar to 7.73 billion by 2026. (Statista)
2. Email marketing boasts a remarkable ROI of $36 for every $1 spent. (Litmus)
3. Global email marketing revenue stood at $7.5 billion in 2020, with projections hitting $17.9 billion by 2027. (Statista)
4. The number of global email users is on track to exceed 4.48 billion in 2024 – more than half the population (Statista)
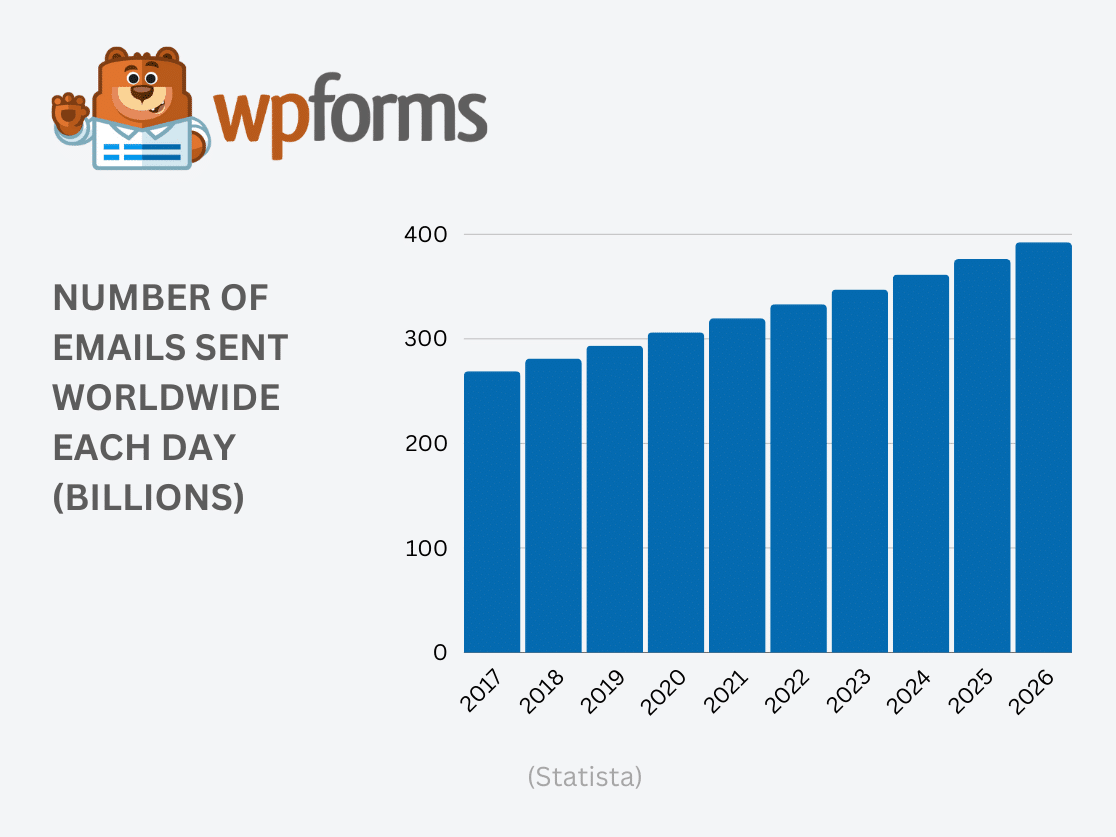
5. An estimated 333.2 billion emails were sent daily in 2022, with this figure predicted to climb to 392.5 billion by 2026. (Statista)
6. Two-thirds of marketers use email to distribute content. (Content Marketing Institute)
7. Segmented, targeted, and personalized email campaigns are responsible for 58% of all email marketing revenue. (Instapage)
8. About 59% of consumers admit that marketing emails sway their purchase decisions. (SaleCycle)
9. Email marketing campaigns can have click-through rates 50 to 100 times higher than those of Twitter and Facebook. (Mailmunch)
10. A significant 63.3% of people check their emails at least twice a day, with 25.4% checking more than five times a day. (Mailjet)
11. 73% of marketers view email as crucial to their company’s success. (Litmus)
12. More than half of marketers (51%) rate email marketing as their most effective channel. (Hubspot)
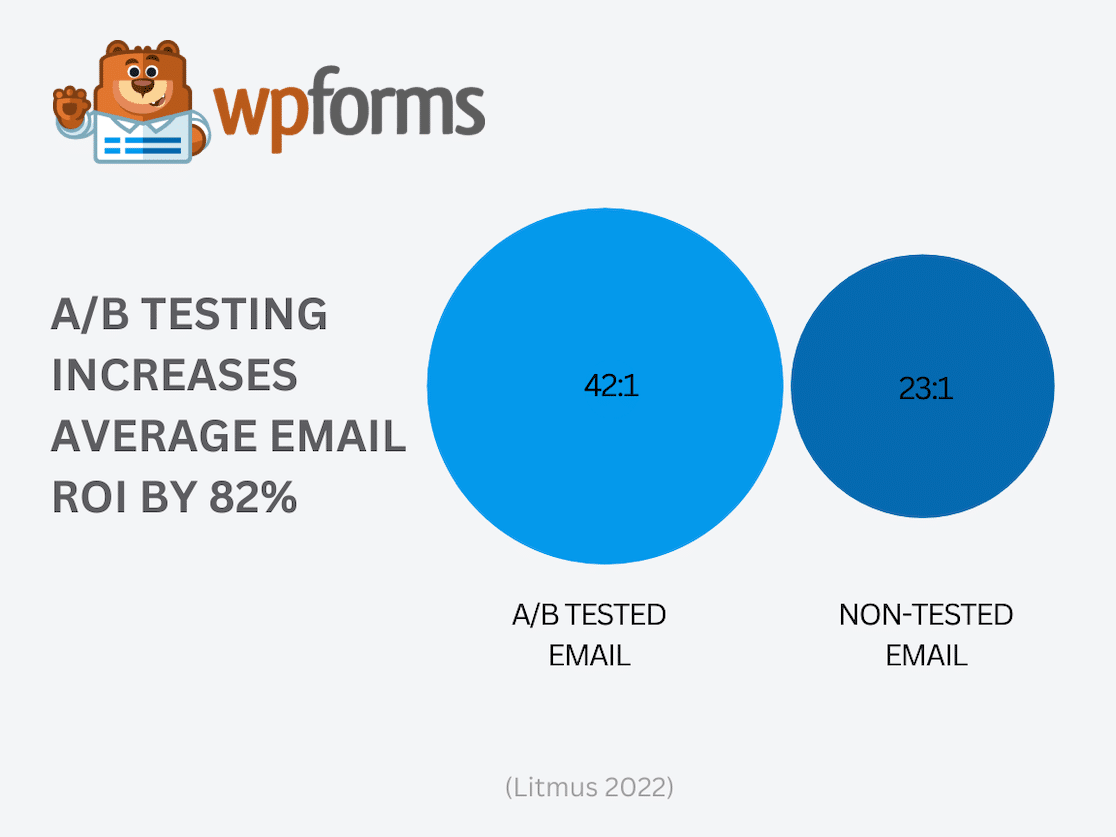
13. Regular A/B testing of emails can boost ROI by an average of 82%. (Litmus)
14. Nearly 40% of people who click on an automated email end up making a purchase. (Omnisend)
15. 51% marketers believe email is the most effective channel for early-stage lead generation. (Demand Gen Report)
16. 50% of consumers make purchases from marketing emails at least once a month. (SaleCycle)
17. 50.2% of consumers are likely to click through on a discount email to learn more or use a promo code. (Mailjet)
18. A significant 78.5% of consumers want to hear from brands they love at least once a week. (Mailjet)
19. 56.4% of email subscribers say they subscribe to regularly receive special offers, and 52.5% sign up to newsletters to receive a one-off discount. (Mailjet)
20. 27% of US consumers are likely to be influenced into making a purchase by a brand’s regular newsletter. (Statista)
21. 72% of eCommerce marketers cite low open rates as their primary email marketing challenge. (Hubspot)
22. 90% of Americans subscribe to at least one email newsletter, with 74% subscribed to 2-10 newsletters. (Storydoc)
23. Almost all Americans who use email (97%) check their inbox at least once a day. (Storydoc)
24. Nearly 30% of businesses plan to increase their email marketing budget in the next year. (Litmus)
25. 39% of people sign up for newsletters to receive discounts, with 16% seeking exclusive content and 5% keen to know about product updates. (Storydoc)
26. 34% of consumers are more likely to purchase from emails than other marketing channels. (Litmus)
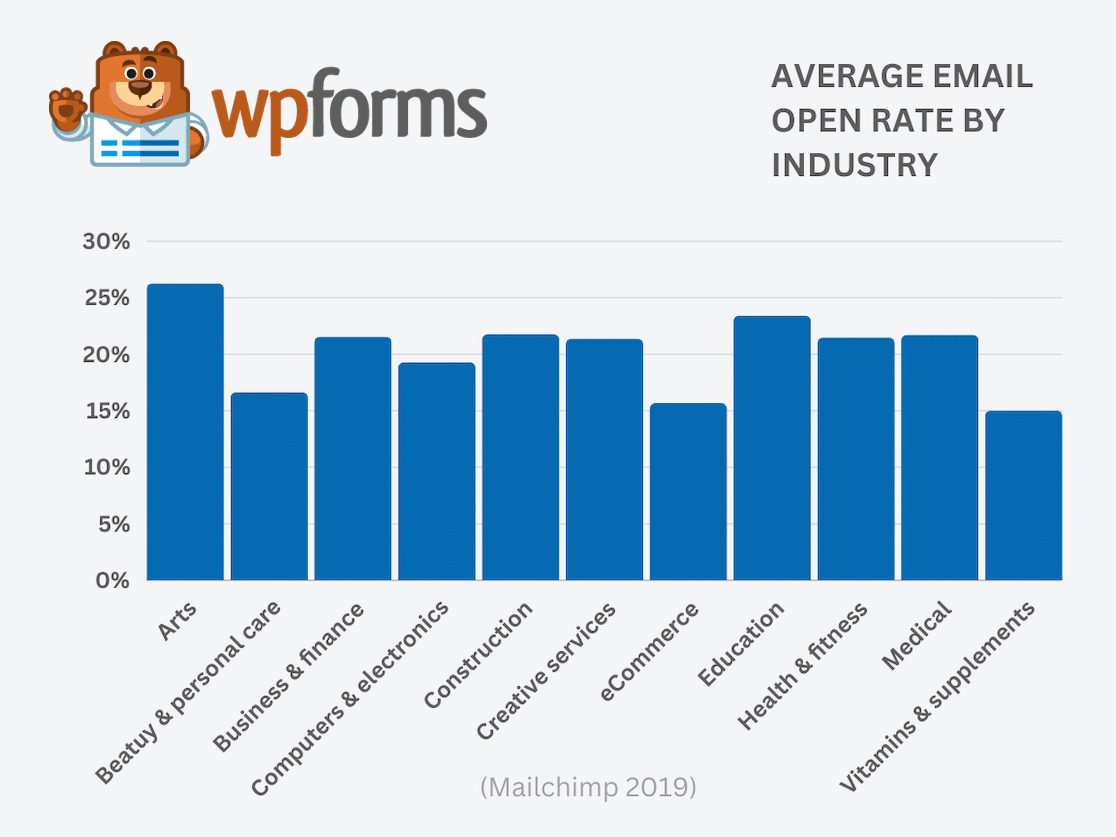
27. The average email open rate across industries is 21.33%. (Mailchimp)
28. Automated email messages have a 91.5% higher open rate than scheduled email campaigns. (Omnisend)
29. Half of all small and medium-sized businesses use marketing automation software to send drip campaigns and keep people engaged. (Instapage)
30. 47% of email recipients open an email based solely on the subject line. (OptinMonster)
31. 43% of marketers using generative AI find it most helpful for creating emails. (Hubspot)
32. Segmented email campaigns can boost revenue by as much as 760%. (Campaign Monitor)
33. Around 50% of marketers use lead magnets to gather email addresses. (Hubspot)
Social Media – Stats and Facts
Social media has transformed how we spend our leisure time, with more people scrolling through feeds and engaging with content than ever before.
This shift hasn’t gone unnoticed by brands, which are now leveraging a range of platforms to reach their target audiences. It’s not just about ads; consumers are increasingly discovering products and services through social media, often leading them directly to company websites with just a click.
Use the statistics we’ve compiled to uncover the immense potential social media holds for propelling your success forward and helping you choose platforms to focus on.
1. Globally, there are over 4.95 billion social media users. (Statista)
2. An impressive 93.5% of internet users engage with social media each month. (Data Reportal)
3. Social media is expanding rapidly, with approximately 9.6 new users joining every second. (Data Reportal)
4. Social commerce revenue is expected to surpass $1.2 trillion in 2024, potentially reaching $6.2 trillion by 2030. (Statista)
5. By 2025, social commerce is predicted to account for over 16% of total e-commerce revenue. (Accenture)
6. On average, users spend around 2 hours and 27 minutes on social media daily. (Data Reportal)
7. 29% of marketers are considering social media for targeted ads as a strategy to adapt to the phase-out of third-party cookies. (Hubspot)
8. Potential for lead generation was the most commonly cited reason for investing in new social media platforms in 2023. (Statista)
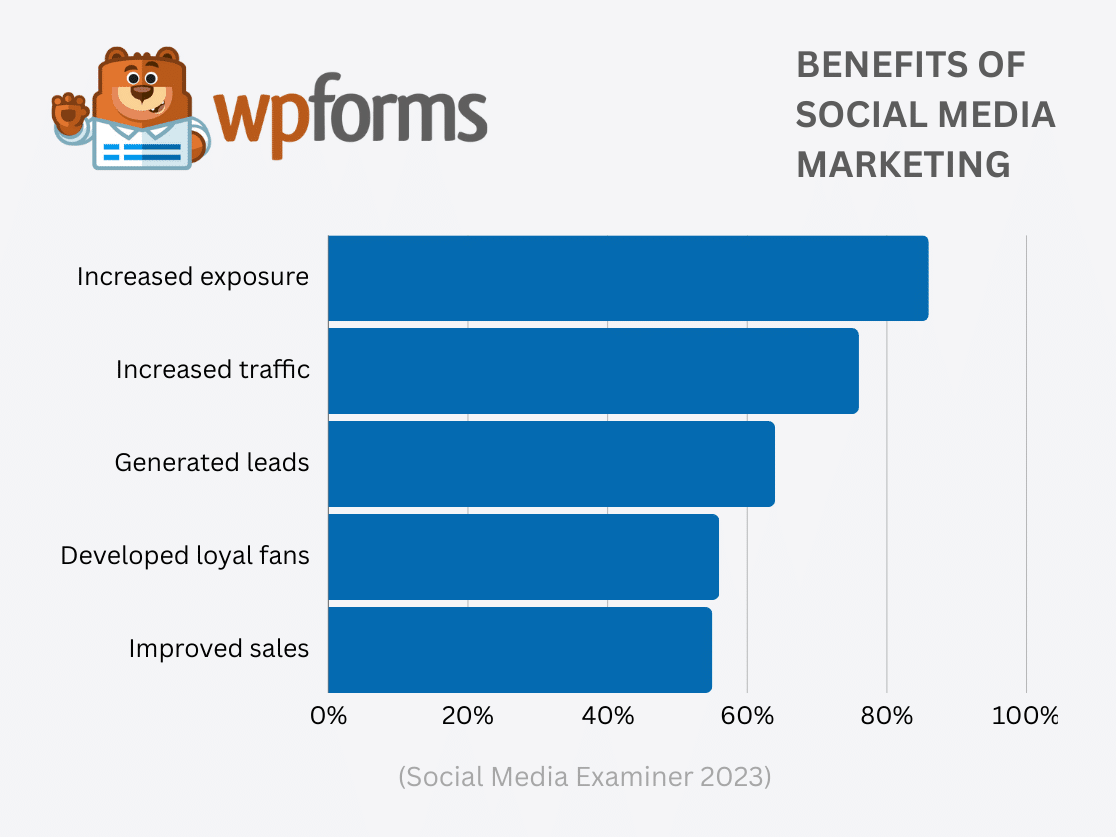
9. Approximately 30% of Gen Z and Millennials have made direct purchases via social media in the past three months. (Hubspot)
10. Facebook and LinkedIn are leading platforms for lead generation, as indicated by 43% and 42% of marketers, respectively. (Social Media Examiner)
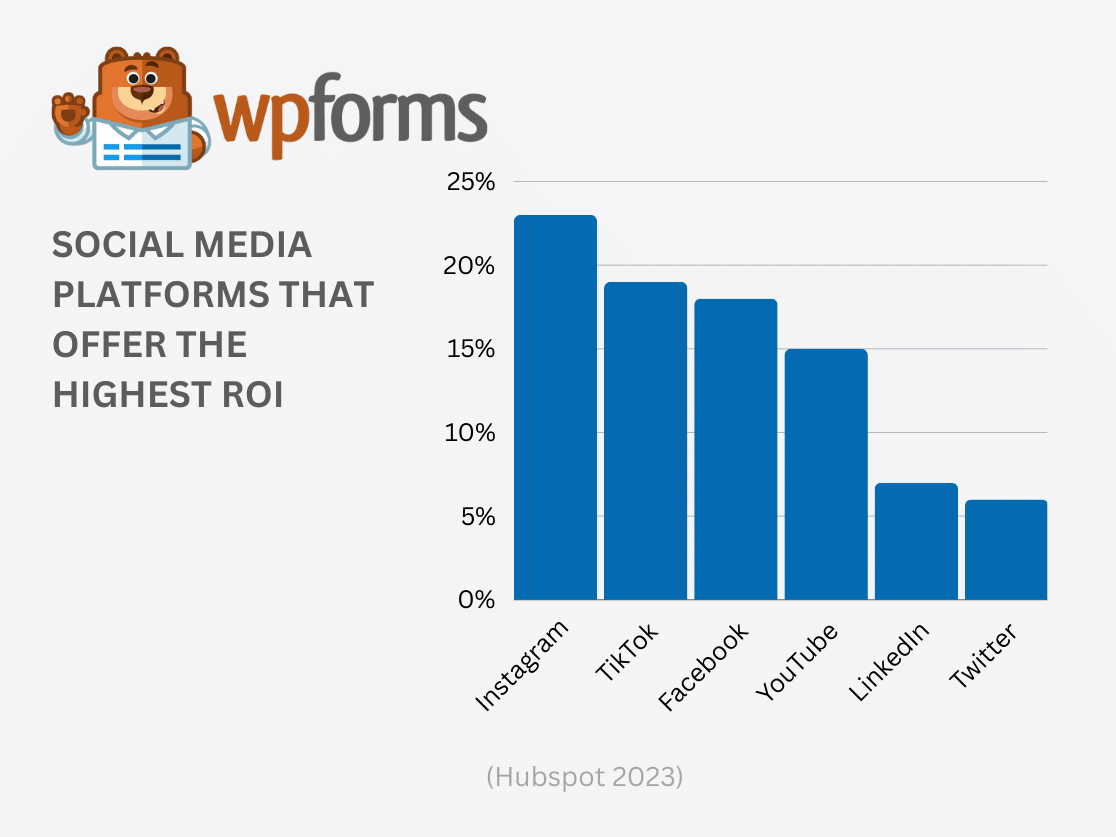
11. Facebook is the top marketing platform for 64% of brands, followed by Instagram and YouTube. Facebook was also voted top in terms of ROI with 22% of marketers reporting they’d had the best results on the platform. (Hubspot)
12. A quarter of brands are now selling directly through social media platforms, such as Instagram shops. (Hubspot)
13. Around 35% of Gen Zers primarily use social media to follow brands and products. (Hubspot)
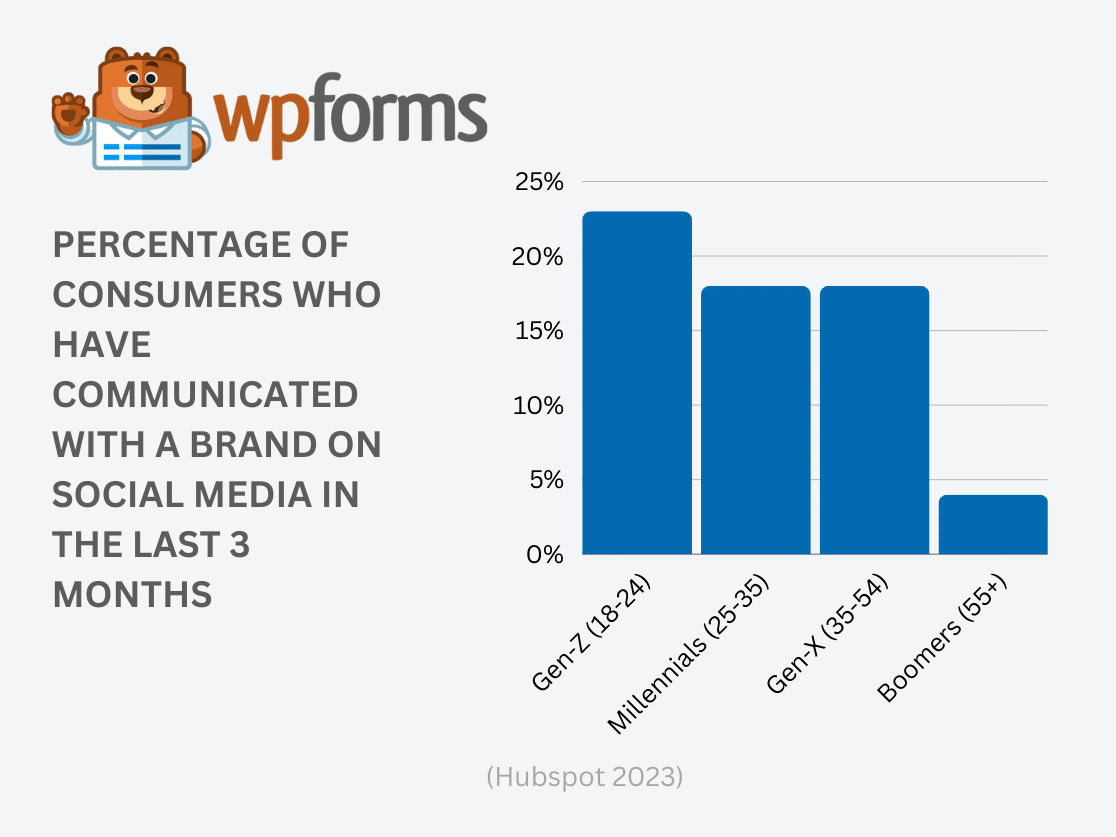
14. 23% of Gen Zers have reached out to brands for customer service via social media in the last three months. (Hubspot)
15. 80% of social media marketers believe that most companies will feature a creator or influencer as the face of their brand within the next couple of years. (Hubspot)
16. 21% of social media users aged 18-54 have made purchases prompted by recommendations from influencers in the past three months. (Hubspot)
17. Instagram is considered the best for ROI, engagement, and quality leads by 23% of brands. (Hubspot)
18. Over 70% of Americans express concern about their personal data in the hands of social networking companies. (Pew Research Center)
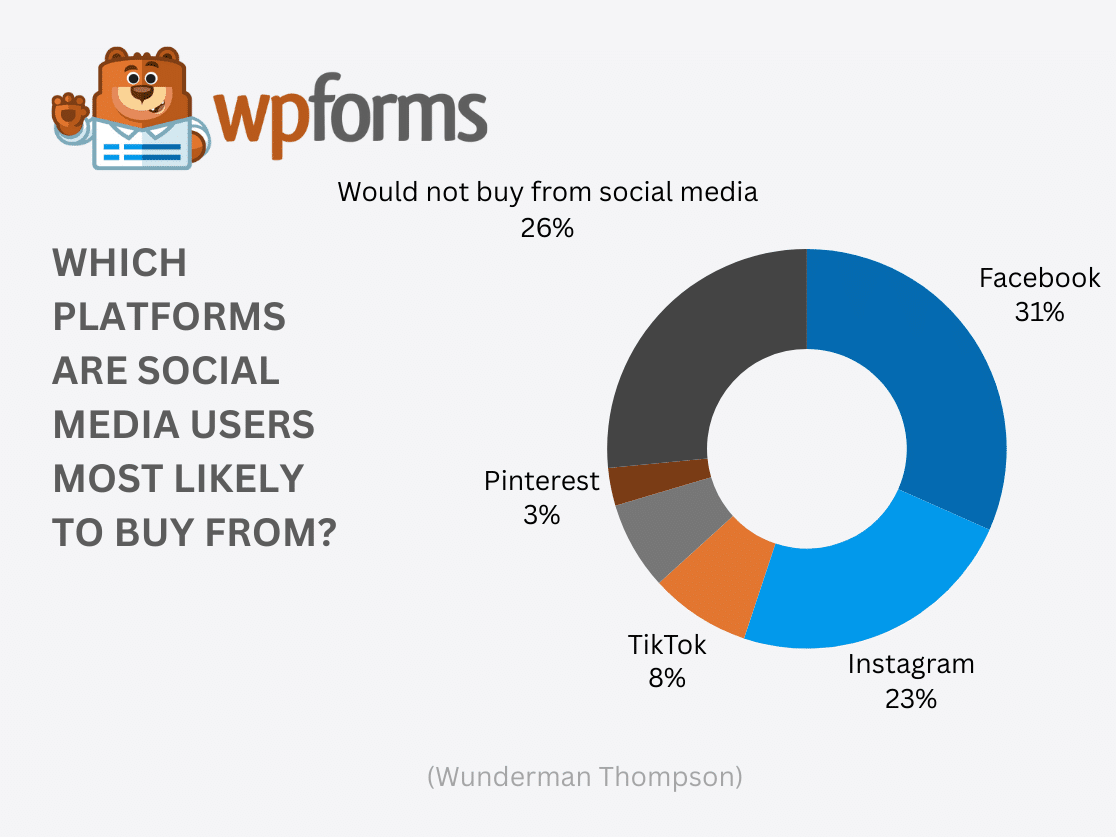
19. 31% of online shoppers prefer Facebook for purchases, while 39% of Gen-Z shoppers favor Instagram. (Wunderman Thompson)
20. 53% of Americans shop on social media at least once a week. (Influencer Marketing Factory)
The Use of AI in Online Business – Statistics and Facts
From personalized customer experiences to streamlined operations and beyond, AI is reshaping the way companies operate on the web.
This section is dedicated to sharing statistics and facts that highlight AI’s growing influence in online business. You’ll gain insights into how AI technologies are not only optimizing current processes but also unlocking new opportunities for growth and competitive advantage.
1. 35% of companies worldwide use AI in their business (Exploding Topics)
2. Over 50% of companies plan to incorporate AI technologies into their operations in 2023. (Exploding Topics)
3. The most popular business use for AI is customer service, with 56% of customers using it for this purpose. Also popular are cybersecurity and fraud management (51%), customer relationship management (46%), digital personal assistants (47%), inventory management (40%), and content production (35%). (Forbes)
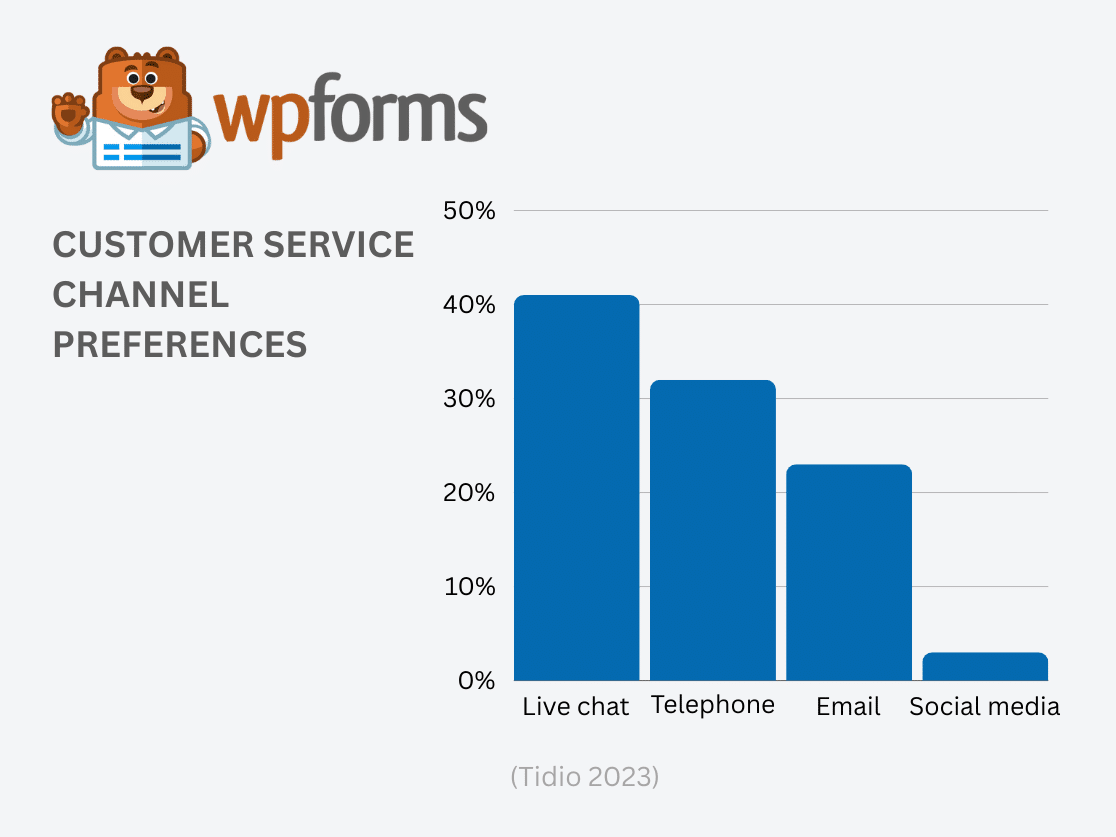
4. 73% of businesses use or plan to use AI-powered chatbots for instant messaging. (Forbes)
5. 30% of respondents are concerned about AI-generated misinformation, while 24% worry that it may negatively impact customer relationships. (Forbes)
6. The artificial intelligence market is projected to reach $305.9 billion in 2024. (Statista)
7. 28% of business leaders say that their business has saved costs through the use of AI. (Hubspot)
8. The average employee saves 2.5 hours a day by using AI and automation. (Hubspot)
9. ChatGPT boasts the fastest-growing user base in history, reaching 100 million monthly active users just two months after launch. (Reuters)
10. (55%) of organizations increased investment in generative AI in 2022. (Gartner)
11. 78% of executives believe that the benefits of generative AI outweigh its risks. (Gartner)
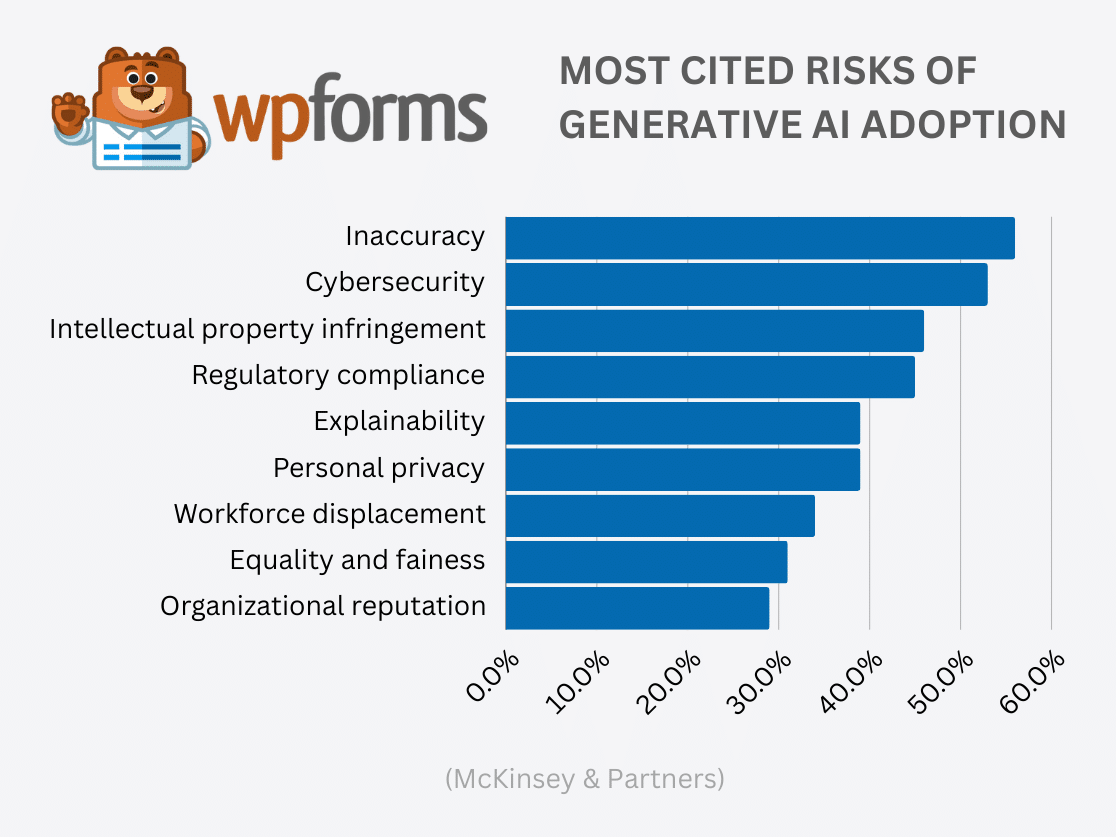
12. Potential risks of AI that organizations worry about most include inaccuracy (56%), cybersecurity (53%), and intellectual property infringement (46%). (McKinsey)
13. Nearly 40% of business leaders using AI in their organizations expect more than 20 percent of their companies’ workforces will be reskilled. (McKinsey)
Alright, I’m Inspired to Grow My Business! What’s Next?
Now you should have tons of ideas on how to grow your business. All you need are the tools to make your online business more successful.
WPForms Pro is the best way to do that because you can:
- Save Time with Templates: Access 2,000+ WordPress form templates for quick form creation, catering to various business needs such as contact forms, payment forms, and surveys.
- Enhance User Experience: Employ smart conditional logic to personalize forms based on user behavior, increasing form completion rates.
- Stay Informed Instantly: Set up instant notifications to receive alerts when forms are submitted, enabling quick follow-up actions.
- Improve Form Completion Rates: Use multi-step forms to break down lengthy forms, making them less daunting and more user-friendly.
- Streamline Payments: Integrate seamlessly with payment platforms like PayPal and Stripe for easy collection of payments, donations, and orders and add a coupon code field to your order forms to boost sales.
- Grow Your Audience: Connect with email marketing services to expand your email list and engage effectively with your audience.
Create Your WordPress Form Now
Next, Grow Your Business’ Email List
And there you have it! The ultimate list of online business statistics designed to help you find ways to improve your business, grow your audience, and make more money online.
Just remember, when it comes to generating leads for your online business, web forms rank as the best way.
If you’re in need of a beginner friendly and simple to use form builder for WordPress, be sure to read about how to grow your email list fast using WPForms.
Ready to build your form? Get started today with the easiest WordPress form builder plugin. WPForms Pro includes lots of free templates and offers a 14-day money-back guarantee.
If this article helped you out, please follow us on Facebook and Twitter for more free WordPress tutorials and guides.

