


AI Summary
You ran a survey on your WordPress site, and the responses are coming in. Now you’re scrolling through a long list of individual entries, trying to work out what they actually mean.
Reading every response by hand gets old fast, and it rarely gives you the big picture. WPForms can turn those raw answers into charts, filtered views, and reports you can share.
Below, I’ll walk you through how to set everything up, get survey responses, reading your results, filtering them, and sharing a clean report.
Create Your Survey Form Now! 🙂
How to Analyze Survey Results in WordPress with WPForms
WPForms Pro includes a Surveys and Polls addon built for exactly this. Once you turn on survey reporting, it collects every response and builds visual reports automatically, so you can spot patterns at a glance instead of counting answers yourself.
Step 1: Install WPForms and the Surveys and Polls Addon
Your first move is to get WPForms installed on your WordPress site. It’s the most beginner-friendly form builder around, with 2,100+ form templates that cover everything from a simple contact form to a detailed customer survey.
What I like most about using WPForms for surveys is that the analysis lives in the same place you build the form. You don’t export anything or sign in to another service. The reporting is built right into the Surveys and Polls addon, so your charts update as new responses arrive.
Surveys and Polls is a paid feature, so you’ll need a WPForms Pro license or higher, which unlocks the survey reports, NPS scoring, and Likert scale fields we’ll use below.
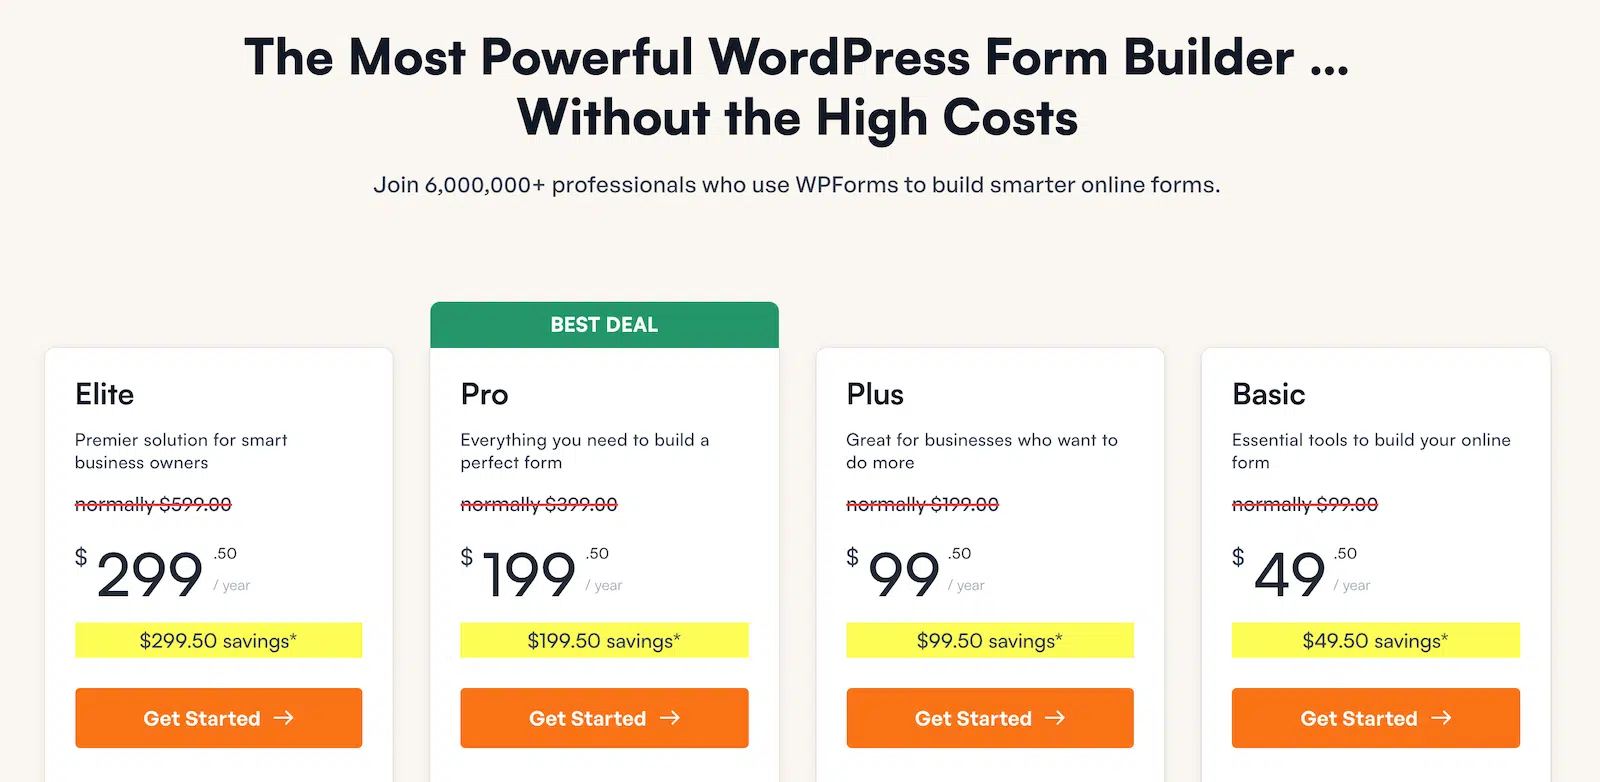
To get started, buy the Pro license. Then install WPForms on your website. If you need help, follow these instructions on how to add a plugin to WordPress.
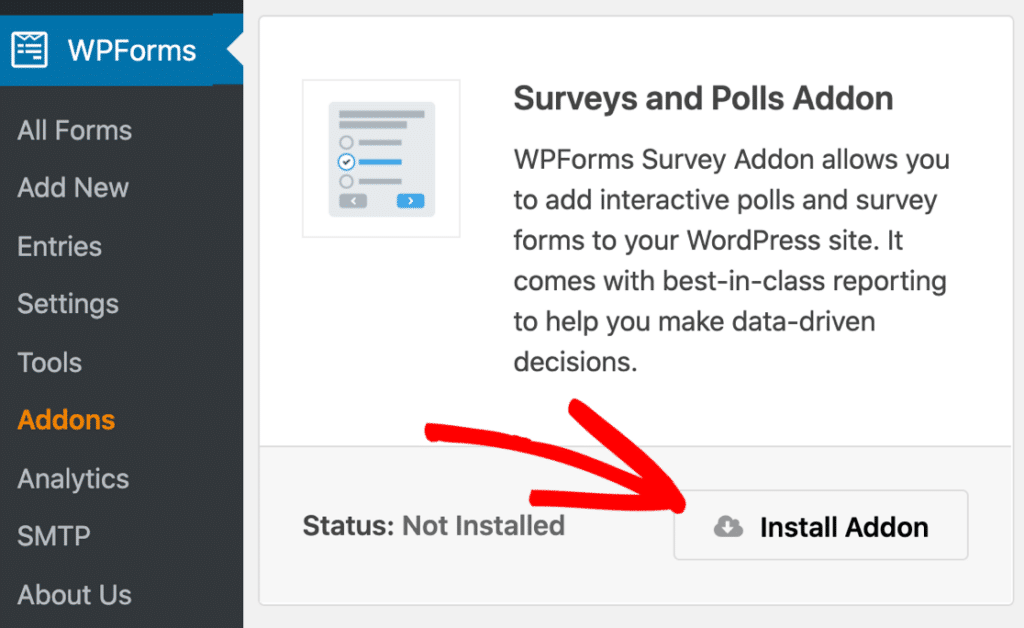
Once WPForms Pro is active, go to WPForms » Addons and find the Surveys and Polls addon. Click Install Addon, and it activates on its own a moment later.
Step 2: Enable Survey Reporting on Your Form
Before WPForms can build any charts, it needs to know which fields to track, and that’s the job of survey reporting. You can switch it on for the whole form in one click, or turn it on for specific fields.
You’ll also need a survey form that’s already collecting responses. If you haven’t built one yet, follow our guide to create a survey form first, then come back here.
After that, open your form in the builder and go to Settings » Surveys and Polls. Then, toggle on Enable Survey Reporting to collect results for every supported field at once.

Want results for only certain questions instead? Go ahead and leave the form-wide setting off. Then open the field you care about, click the Advanced tab, and check Enable Survey Reporting there.

If your form already collected entries before you switched reporting on, those earlier responses still show up in your reports. You won’t lose any of your history by enabling it later.
Step 3: Open the Survey Results Page
With reporting turned on, you’re ready to see your data. Go to WPForms » All Forms and hover over your survey’s title. A row of options appears, and one of them is Survey Results. Click it.

This opens the Survey Results page, where every reportable field gets its own card. Each card pairs a graph with a breakdown of the responses, so you can read one question without losing track of the others.
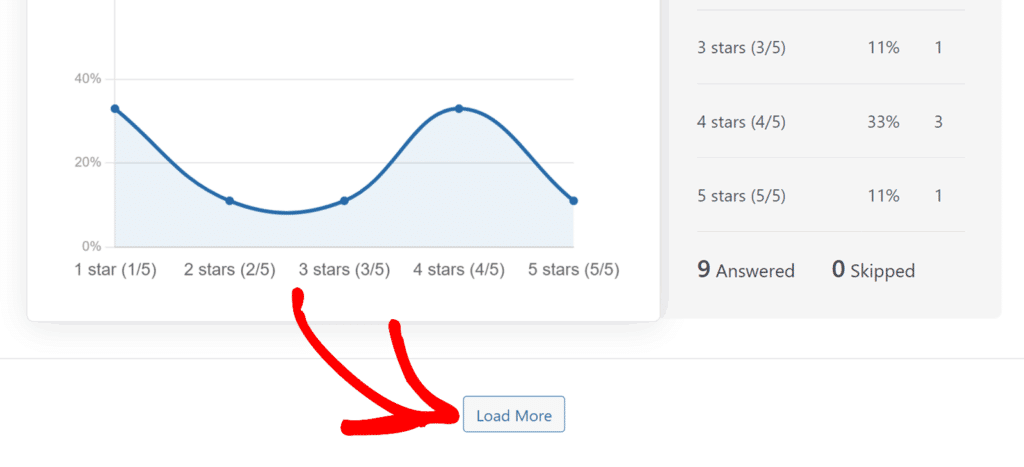
To keep things fast on a longer survey, WPForms shows only the first five fields at first. Scroll to the bottom and click Load More to bring in the rest.
When you’re previewing your form entries, WPForms shows a single survey result right at the top of the page. Click the field name to switch between questions, and click View Survey Results when you want the complete report.

Step 4: Filter Your Survey Responses
A full report is useful, but the real insight often comes from narrowing it down. The Filters menu sits in the top right of the first card, and whatever you set there applies to every field with a supported graph.

Start with the Date Range filter. You can pick a preset like Last 7 days, Last 30 days, or Last 1 year, or choose Custom to set your own start and end dates.
Below that, the Questions and Answers section lists every question and its answer choices. Check specific answers to see only the people who chose them, or check the question label to include everyone who replied.
Once you’ve built a filter you like, click the save icon to keep it for next time. The plus icon checks a whole group at once, and the minus icon clears it.

Step 5: Customize Your Survey Charts
The default charts look good, but you’ll often want to change how a specific question is shown. Click the gear icon in the top right of any card to open its graph settings.

The first choice is Graph Style, but you can switch between Line, Vertical Bar, Horizontal Bar, and Pie.
A pie chart works well when you want to show share of a whole, while a bar chart is easier to read when you’re comparing several answers side by side.

From the same panel, you can set the Graph Color and adjust the Graph Size from small all the way up to a full-width layout. If you’d rather show just the numbers, toggle on Hide Graph to keep only the answers table.
On a long survey, setting each chart by hand gets repetitive. So when you land on a look you like, turn on Apply To All Graphs to push those settings across the whole report at once.

Step 6: Read and Interpret Each Field Type
Not every question gets analyzed the same way, and WPForms shapes each report around the field type. Here’s how to read the most common ones.
Choice and rating fields
For Dropdown, Checkboxes, Multiple Choice, and Rating fields, you’ll see a graph on the left and a table of responses on the right.
The table also tells you how many people answered and how many skipped the question. By default, answers are sorted from most responses to fewest, so your most popular choice sits right at the top.
Click the Responses column header if you’d rather sort the other way. If you’re new to the Rating field, it scores answers on a star scale that’s great for quick satisfaction checks.

Likert Scale fields
A Likert Scale field asks people to rate several statements on the same scale, like Strongly Agree down to Strongly Disagree.
Its report shows the number of votes for each option along with the percentage who picked it, which makes the overall lean easy to see.

Net Promoter Score fields
The Net Promoter Score field asks one question on a 0 to 10 scale, then sorts your respondents into three groups.
People who score 9 or 10 are Promoters, 7 or 8 are Passives, and 0 through 6 are Detractors. WPForms calculates your overall score automatically and shows it next to a table of the three groups.

A positive number means you have more fans than critics, and the higher it climbs, the better. If your score comes back low, that’s your cue to dig into the comments and find out why.
Single Line Text and Paragraph Text fields work a little differently. Since there’s nothing to graph, WPForms lists each written response with the date it came in, and you can click through to open the full entry.
Step 7: Export, Print, and Share Your Report
Once you’ve made sense of the numbers, you’ll probably want to get them out of WordPress and in front of other people. Every card has an Export menu in its top right that handles this.
Click Export on any card, and you can choose Current Question to save just that field or All Questions to grab the whole report. For a single question, you can also pick Graph + Data or Graph Only, then save the file as a JPG or PDF.

Prefer a printout or a PDF for your records? Open the same Export menu and choose Print as the format. The printout uses whatever chart settings you set earlier, so it matches what you see on screen.

Those options cover image and PDF formats, but you can also pull the raw numbers into a spreadsheet. To do that, export your entries to a CSV file from the Entries page and open them in Excel or Google Sheets.
Survey results do have one limit worth flagging. They live in your admin area only, and WPForms doesn’t show them on the front end of your site automatically.
If you want to share them publicly, you can display survey results on the front end by saving a report as an image and embedding it on a page.
FAQs About Analyzing Survey Results in WordPress
Still have questions about how to view survey results and build a survey results report in WordPress? Here are answers to the ones I hear most often.
Can I display survey results on the front end of my site?
Survey results are designed for your admin area, so they stay private by default. If you want to share them publicly, save a report as a JPG image and embed it on any page or post.
What chart types can I use for my survey results?
WPForms gives you four chart types to work with. You can switch between Line, Vertical Bar, Horizontal Bar, and Pie per question from the graph settings. Bar and pie charts tend to work best for choice questions, while a line chart suits data you’re tracking over time.
How is the Net Promoter Score calculated?
WPForms subtracts the percentage of Detractors from the percentage of Promoters to give you a single score between -100 and 100. It works this out automatically, but if you want the full breakdown, here’s how to calculate your Net Promoter Score.
Can I export my survey results to a spreadsheet?
The survey report itself saves as a JPG or PDF rather than a spreadsheet. To work with the raw numbers in Excel or Google Sheets, export your form entries to CSV from the Entries page instead.
Can I merge the results of two survey fields?
WPForms keeps each field’s results separate, so there’s no built-in way to merge two questions into a single chart. For a blended view, export the data and combine it in your own spreadsheet.
Do reports include entries collected before I turned on reporting?
When you enable survey reporting, WPForms pulls in the responses your form gathered earlier too. You won’t lose any historical data by turning it on later than you’d planned.
How do I write a summary of my survey results?
Start with the headline numbers from each chart, then pull out the two or three findings that matter most for your goal. If you’d like a framework to follow, we have a full guide on how to write a summary of your survey results.
Is the Surveys and Polls addon free?
The addon requires a WPForms Pro license or higher, so it isn’t part of the free Lite version. Pro also unlocks NPS scoring, Likert scale fields, and the full survey reporting tools covered in this guide.
Next, Turn Your Survey Data Into Better Decisions
Now that you can read your reports, the next step is acting on them. If you’re weighing how WPForms stacks up against dedicated platforms, our roundup of survey data visualization tools is a good place to compare your options.
And if you’re already planning your next survey, it helps to know the types of surveys you can run and which questions suit each one.
Create Your Survey Form Now! 🙂
Ready to build your form? Get started today with the easiest WordPress form builder plugin. WPForms Pro includes lots of free templates and offers a 14-day money-back guarantee.
If this article helped you out, please follow us on Facebook and Twitter for more free WordPress tutorials and guides.