
AI Summary
So you ran a survey, the responses are rolling in, and now you’re staring at a wall of raw data wondering what to actually do with it. A spreadsheet full of numbers doesn’t exactly tell a story, and it definitely doesn’t make for a great team presentation.
The good news is you don’t need a separate data tool or any design skills to fix that. If you collected your responses with WPForms, you can turn them into clean pie charts, bar graphs, and line charts in a few clicks, right inside WordPress.
In this tutorial, I’ll walk you through how to display survey results graphically, from finding your responses to embedding a finished chart in your report. I’ll also cover which chart type to reach for, since that’s the part most people get stuck on.
How to Display Survey Results Graphically
The whole process runs through the WPForms Surveys and Polls addon, which automatically turns your form responses into visual reports. Here are the five steps, from installing the addon to embedding your finished charts.
In This Article
Step 1: Install the WPForms Pro Plugin
The charts and graphs in this tutorial come from the WPForms Surveys and Polls addon, which automatically visualizes your form data without any spreadsheets or third-party tools. WPForms also gives you a head start with ready-made survey form templates, so you’re not building from scratch.
What I like most about WPForms for surveys is that the reporting is built right in. You collect responses and get the charts in the same place, instead of exporting your data somewhere else just to make it readable.
The Surveys and Polls addon is a Pro feature, so you’ll need a WPForms Pro license (or higher) to follow along. That’s also the tier where you get the full set of chart types and the interactive reports.
To get started, buy the Pro license. Then, install WPForms on your website. If you need help, follow these instructions on how to add a plugin to WordPress. Once it’s active, head to WPForms » Addons and install the Surveys and Polls addon (here’s the full addon setup guide if you want the details).
Step 2: Find Your Survey Results
Once your form is collecting responses, the first thing to do is find your results. Head over to WPForms » All Forms in the left-hand panel of your WordPress dashboard to locate your survey form.

Next, hover your mouse over your survey form and click on Survey Results.

This opens the survey results dashboard, where all your responses are already organized and ready to chart.
Step 3: Generate Your Charts and Graphs
Now for the fun part. Click the pie chart icon in the upper-right corner of your survey results dashboard, and WPForms generates your pie chart automatically.

This works with Net Promoter Score (NPS) surveys too. If you want to set one of those up, here’s how to create an NPS survey in WordPress.
Want to change the colors on your pie chart? Just click any other chart icon and then back to the pie chart icon, and WPForms recolors all the sections for you.

You’re not limited to pie charts, either. Click the other icons to switch the same data into line charts or vertical and horizontal bar graphs, whichever tells your story best. Your data is generated into clean reports that are easy to read at a glance.

Scroll down the page in this section and you’ll also find your Likert Scale survey responses laid out in their own table.

For this tutorial, let’s stay at the top of the page and move forward with exporting the pie chart.
Step 4: Export Your Charts and Graphs
When you’ve got a chart you like, click the Export dropdown in the top-right corner.

From here, you can save the chart as a JPG or a PDF, or print it. For this example, let’s save it as a standard image file (JPG) so it’s easy to drop into a report.

Repeat this for each chart you want to include. In a minute or two you’ll have a tidy set of images ready to use.
Step 5: Embed Your Charts and Graphs
Now that you have JPGs of all your charts, you can embed them wherever you’re presenting your survey results. This is especially handy when you’re sharing findings with a team or a client.
Google Slides is a great (and free) place to start. Just drop your chart images onto a slide and you’ve got a presentation. You can also write a summary of survey results and embed your charts right into the document for a more detailed report.
That’s the whole process. Once you’ve done it once, charting your survey data takes only a couple of minutes.
Which Chart Type Should You Use for Survey Results?
WPForms gives you several chart types, and picking the right one makes your results much easier to understand. Here’s a quick guide to when each one works best.
| Chart type | Best for | Keep in mind |
|---|---|---|
| Pie chart | Single-choice questions with only a few answer options | Gets hard to read past five or six slices |
| Bar or column chart | Comparing answers across categories (2 to 7 groups) | The most flexible, all-purpose choice |
| Line chart | Tracking how responses change over time | Needs data collected across multiple dates |
| Likert / stacked bar | Agreement and rating-scale questions | Shows the full spread from “strongly agree” to “strongly disagree” |
If you’re not sure, a bar chart is almost always a safe pick. It handles most question types and it’s the easiest for people to read quickly.
For questions where respondents picked a single option, like “which plan are you on,” a pie chart shows the split nicely as long as you don’t have too many options. Save line charts for tracking a metric across weeks or months, like satisfaction over time. And for rating questions, the Likert layout shows how opinions spread out far better than a single average ever could.
If you want to go beyond what’s built in, here’s a roundup of survey data visualization tools worth a look.
FAQs About Displaying Survey Results
Displaying survey data graphically is a common question for WordPress site owners running surveys and polls. Here are answers to the ones I hear most.
What’s the best chart type for survey results?
For most survey questions, a bar or column chart is the safest choice because it’s easy to read and works for almost any data. Use a pie chart for single-choice questions with only a few options, a line chart for tracking responses over time, and a stacked bar for Likert scale or rating questions.
How do I present survey results to my team?
Export your charts from WPForms as JPG or PDF files, then drop them into presentation software like Google Slides or PowerPoint. Pairing each chart with a short takeaway sentence keeps your audience focused on what the data actually means.
Can I display survey results in WordPress without code?
Yes. With the WPForms Surveys and Polls addon, your responses are turned into charts and graphs automatically. You click a chart icon to generate the visual, and there’s no code or separate spreadsheet involved.
What chart works best for Likert scale questions?
A stacked bar chart is the standard for Likert scale questions because it shows the full range of responses, from “strongly agree” to “strongly disagree,” in one view. WPForms lays out your Likert responses in the survey results dashboard so you can see the spread at a glance.
Next, Export Your Raw Survey Data
Sometimes you’ll want the raw numbers so you can crunch them in a spreadsheet. WPForms makes that easy, too. Check out this guide to exporting survey data to Google Sheets.
And if you’re still deciding how to run your surveys in the first place, here’s a look at the best tools for building online surveys.
Ready to build your form? Get started today with the easiest WordPress form builder plugin. WPForms Pro includes lots of free templates and offers a 14-day money-back guarantee.
If this article helped you out, please follow us on Facebook and Twitter for more free WordPress tutorials and guides.


Hi! Is there a possibility to present survey results live? E.g. the user clicks on “Submit” and the current statistics are shown?
Hi there! I am afraid, currently only Poll results can be shown on front end. Survey results can be seen only in the WordPress dashboard. If it helps, here is a guide to show poll results in confirmation message on submitting the form.
For any further help on this, please drop us a line in support so we can assist. If you have a WPForms license, you have access to our email support, so please submit a support ticket. Otherwise, we provide limited complimentary support in the WPForms Lite WordPress.org support forum.
Thanks 🙂
I actually purchased WP Forms on the assumption that the survey results could be shown live on the front end on a page (e.g. via embed / shortcode etc). This seem like a really important and relatively easy to implement feature via shortcode. I would really ask that you look into providing this please.
Hey Chris – I have gone ahead and added your vote to this feature request. I don’t have an ETA on when it can be implemented but it is always good to have feedback/suggestions from customers so that the dev team can consider new features for the future.
I am sorry for the inconvenience!
I just bought the upgrade to Pro an hour ago based on this assumption, too. Your feature specific pages make it look like it’s possible and that assumption isn’t contradicted anywhere in the specs provided before purchase. We need this feature and other customizations (such as turning off public display response counts) need to be available.
Hey Jules – I apologize for the confusion, currently Survey results can be seen in a graphic format in the WordPress dashboard only. Survey results can’t be shown on front end. The basic reasoning behind this was, usually, Surveys are a private thing which you won’t like to show in public. For example, an employee satisfaction survey will never be displayed by company in the public or a customer survey will not be shared publicly on front end of the site. Admin can see them in the dashboard only.
Polls are something, which are usually shown to public that is why our polls result can be shown on front end.
Still, I totally understand if that is not something you agree with and I have gone ahead and added your vote to this feature request so that that our dev team can consider this for future.
I am sorry for the inconvenience!
Hi!
I purchased wpforms also with the idea to publish the results (filtered by certain input) on the frontend. I was planning to create a private page for each user so that they can see the input that is relevant to them…
I is quitte dissapointing to discover it is not possible to do this. Do you have any idea on when this will be available?
Hey Irian – I apologize! We don’t have an ETA when this feature will be available. I’ve added your vote to the Feature request list. However, if you’re willing you can do this with custom code.
If you need any further help on this please feel welcome to reach out to our support team.
Hope it helps!
Hi there,
Is it possible to filter the survey results by date range and have them seen in the charts?
Hey Alvin– Currently, we do not have a feature to filter and display survey results by date range. I do agree it would be super helpful, though. I’ve made a note of the feature request and we’ll keep it on our radar as we plan out our roadmap for the future.
If you have any questions, please feel free to get in touch with our team.
Thanks, and have a good one :)
Hi, echoing the above too, was not clear that survey’s could not be graphically displayed to the users viewing our website. quite disappointing.
this should be a basic feature if purchased.
Hi Mark! I apologize for any misunderstanding about how our Survey and Poll’s addon works. There is an option to display certain results graphically anywhere on your site. Details on enabling poll results can be found in this article.
I hope this helps 🙂 If you have any further questions about this, please contact us if you have an active subscription. If you do not, don’t hesitate to drop us some questions in our support forums.
Hi – I’m considering purchasing WPforms Pro but I need quiz functionality – a way to survey an individual user and then show them their individual results – e.g. for a personality quiz. Is this possible with WPforms?
Hi Ricken,
Currently, we do not have the built-in to create quiz forms and calculate the grades/score and show results individually. I have added your vote to consider this as a feature request for future enhancements.
Thanks!
I installed your plugin so I could create the occasional poll once in a while. After installation, I added a poll, asked people to interact with it, and then when I went to view the results can’t figure out how to do that. The best I can see is that I have to pay $100 per month to do so. Is this true? If so, why even offer the possibility of a free poll if no one can see the results? Seems like an underhanded way to try to get business. Please just do us all a favor and get our business honestly and directly. Tell us what we can do for free and what we have to pay for and how much it will cost. When businesses try to trick me into giving them money I automatically go elsewhere with my money.
Hi Tissa,
Thanks for writing in and I apologize for any confusion!
WPForms Lite, our free version, does not have the feature to store entries, though you can set form notification emails to send out form submissions to your email address. In case it helps to share, here’s our tutorial with all the details.
Because entries are not stored in WPForms Lite, they will not be available even when you upgrade to the paid version. This is a restriction set by WordPress.org — plugins aren’t allowed to ‘unlock’ content such as entry data in a paid version in this way. So, only the entries that are submitted after the paid version has been activated will get stored and accessible in the backend.
While our Lite plugin isn’t able to collect or store entries in any way beyond sending out the email, some hosting providers do log emails that are sent out from the sites they host. So if you need to try and recover undelivered emails, the best next step in trying to find records of previous entries is to contact your site’s hosting provider to ask if they do this.
I’m sorry for the confusion around this. If you have any suggestions on how we can better clarify this, please let me know and I’ll share those with our team. Here’s a screenshot with our current wording from the Lite Entries page.
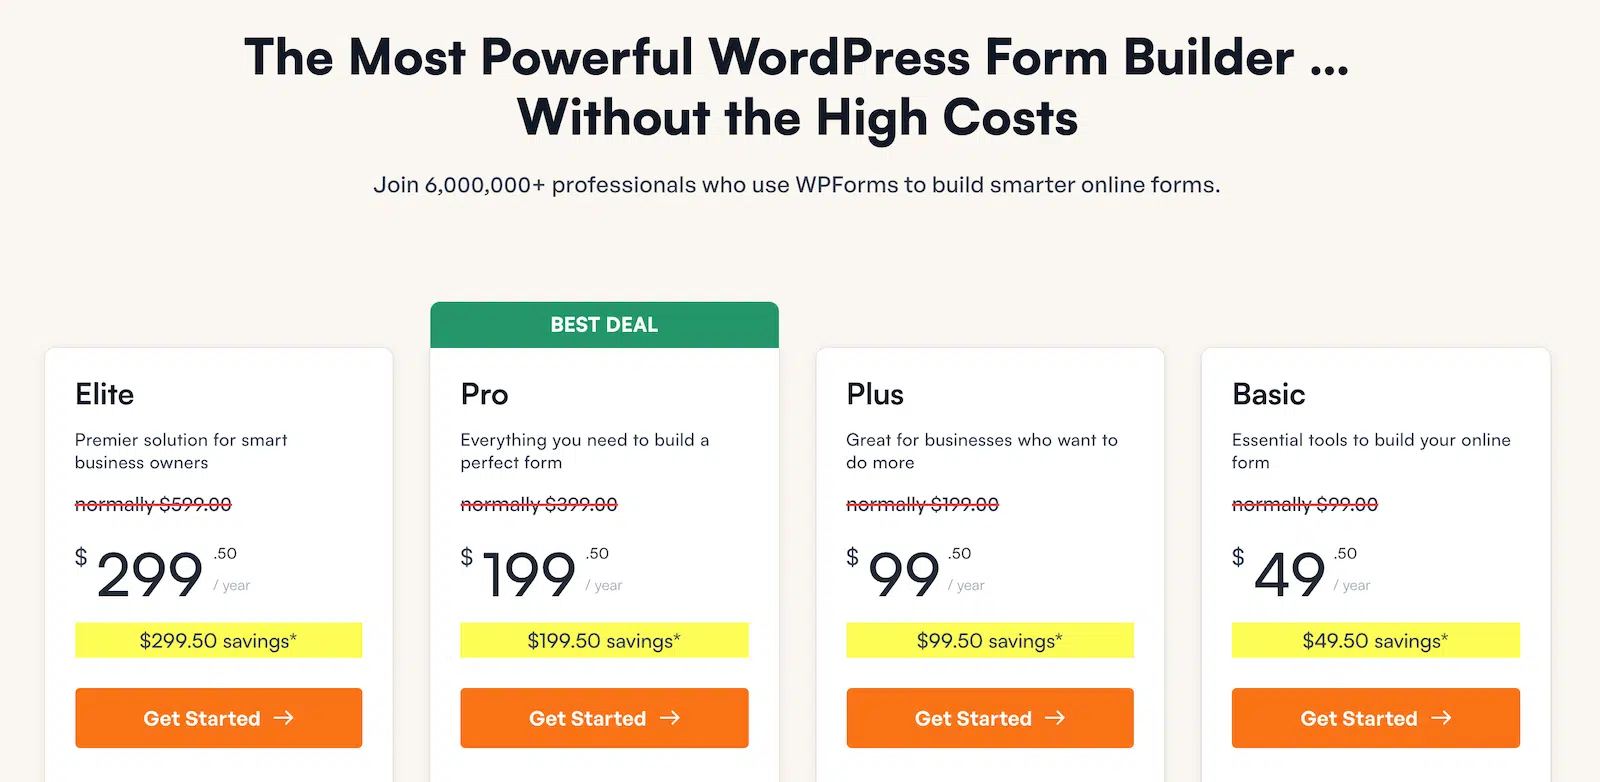
All of our paid versions (starting from $39.50 per year) would have the option to save submitted data to your site’s database. Our subscriptions are also per annum and are not monthly charges. You can see all of our licenses, their pricing, and their included features at our pricing page: https://wpforms.com/pricing/
I hope this helps to clarify 🙂
Thank you and have a great day!
Apparently displaying poll results via a shortcode is STILL not available. I too purchase the plugin based on very recent feedback from wpforms that this was possible.
It’s disappointing that this feature is still not available, even more disappointing as that pre-sales inquiries are still indicating that this is possible when it is not.
Hey Kevin, I do apologize for any confusion. Please know that it is possible to display the Poll results anywhere on your sites using the shortcode and here is our great guide on how to go about it. In case it helps here is the screencast on the same.
That said, in case you are facing some difficulties on the same, please submit a support ticket so that we can advise further.
Thanks.