Looking for some digital marketing statistics? Understanding the ins and outs of how businesses thrive online can really shine a light on where you might want to channel your energy to boost your own online presence.
In this post, we’ve done the heavy lifting for you and compiled a treasure trove of digital marketing statistics.
All of the stats in this article are compiled from studies and reports completed in the last few years, so if you’re looking for up-to-date intelligence and data to grow your business, look no further!
The Ultimate List of Digital Marketing Statistics for 2024
Here’s our ultimate list of digital marketing statistics:
In This Article
Email Marketing Statistics
It’s impossible to ignore the facts on how effective email marketing is — for every $1 spent it averages a return of $36. Stunning numbers like that are why focusing your digital marketing efforts on email marketing is a must for running a successful business online.
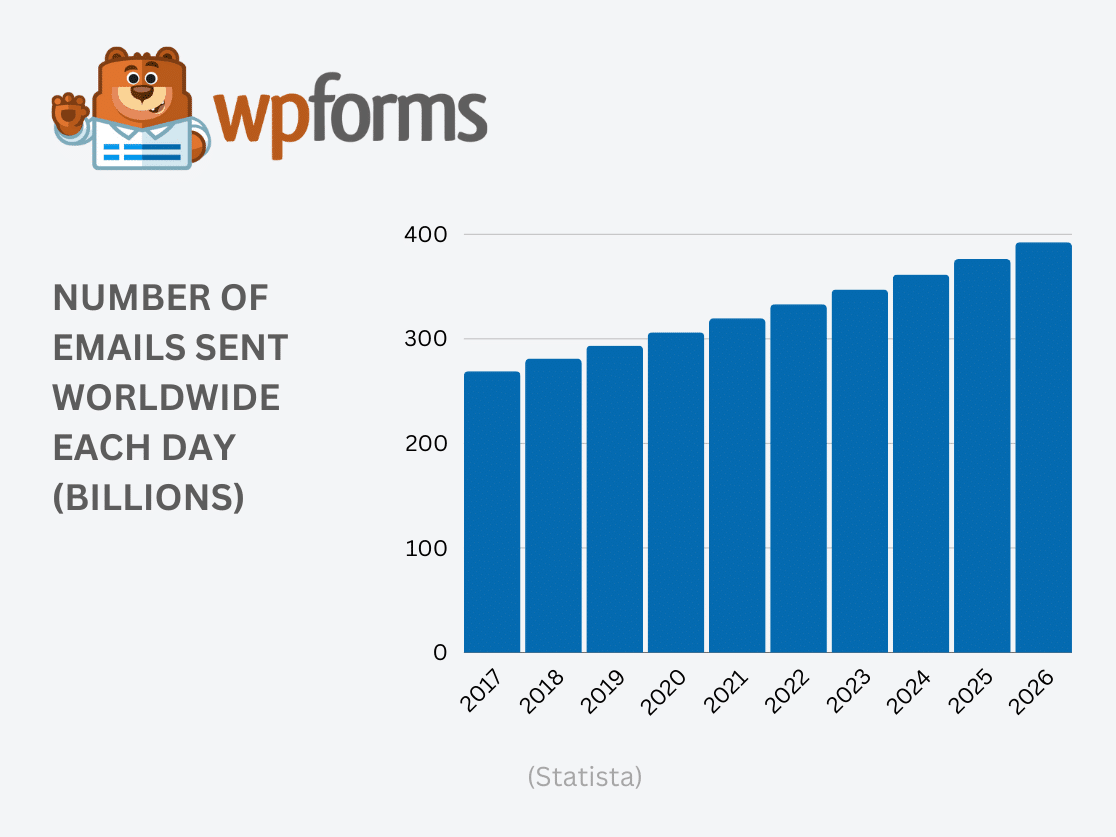
1. 333.2 billion emails were sent daily in 2022, with projections suggesting an increase to 392.5 billion by 2026. (Statista)
2. In 2020, the email marketing industry’s revenue was valued at $7.5 billion, with forecasts predicting a rise to $17.9 billion by 2027. (Statista)
3. The return on investment for email marketing is exceptionally high, yielding an average of $36 for every dollar spent. (Constant Contact)
4. Click-through rates for email marketing surpass those of Twitter and Facebook by 50 to 100 times. (Mailmunch)
5. Over half of marketers (51%) consider email marketing their most effective tool. (Hubspot) (Mailmunch)
6. Email marketing is deemed essential by 44% of CMOs, who allocate 8% of their marketing budgets to it. (Gartner)
7. Automated email campaigns are responsible for 31% of all email-based orders. (Omnisend)
8. Segmentation of subscribers is deemed the top strategy for email campaigns by 78% of marketers. (Hubspot)
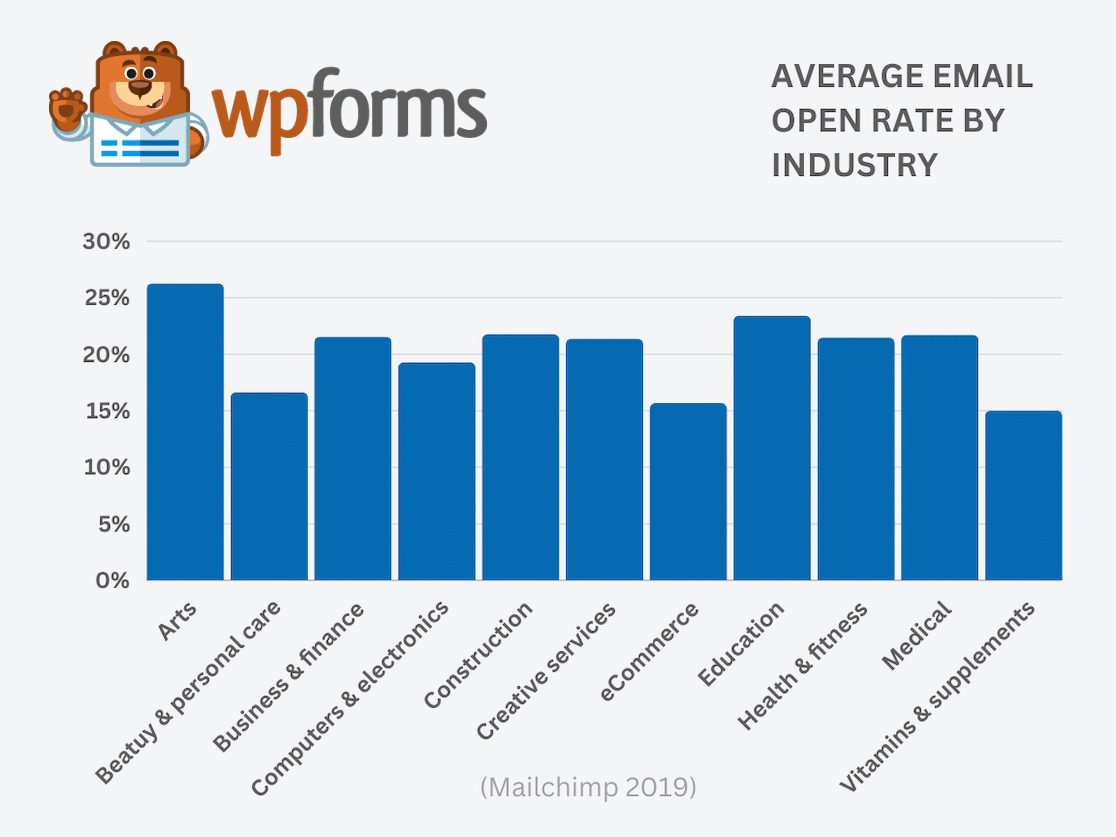
9. Email campaigns average a 21.3% open rate and a 2.62% click-through rate. (Mailchimp)
10. Customized emails result in a 14% increase in click-through rates and a 10% boost in conversions. (Aberdeen Group)
11. Emails featuring a preheader achieve a 32.95% open rate, compared to 25.72% for those without. (GetResponse)
12. Welcome emails and other single-message autoresponders see an impressive 94% open rate and a 31.43% click-through rate. (GetResponse)
13. The average email open rate across industries is 21.33%. (Mailchimp)
14. A significant portion of Americans (59%) say the emails they receive are not useful. (Edison Mail)
15. Half of all consumers (50.2%) will engage with emails offering discounts. (Mailjet)
16. Weekly emails are preferred by 78.5% of brand followers. (Mailjet)
17. Regular newsletters from brands influence purchasing decisions for 27% of US consumers. (Statista)
18. Responsive design in emails can lead to a 5-15% increase in click rates. (Mailchimp)
19. A notable 25.7% of email users prefer viewing emails in dark mode. (Litmus)
20. More than half of the population (63.3%) checks their email at least twice daily, with 25.4% doing so over five times a day. (Litmus)
21. A majority of marketers (73%) acknowledge the critical role of email in their company’s success. (Litmus)
22. Data privacy changes relating to email have influenced the marketing strategies of 86% of marketers in the past year. (Hubspot)
23. The top challenge for 41% of marketers is constructing effective emails. (Litmus)
24. On average, consumers dedicate 10 seconds to reading a brand’s email. (Statista)
25. Email newsletters are the primary content marketing tool for 81% of B2B marketers. (Content Marketing Institute)
26. 61% of email senders report increasing challenges in email deliverability. (Validity)
27. Annually, typos in email addresses lead to over 10 billion bounced emails. (ZeroBounce)
28. Mobile devices are responsible for more than 58% of overall web traffic. (Statista)
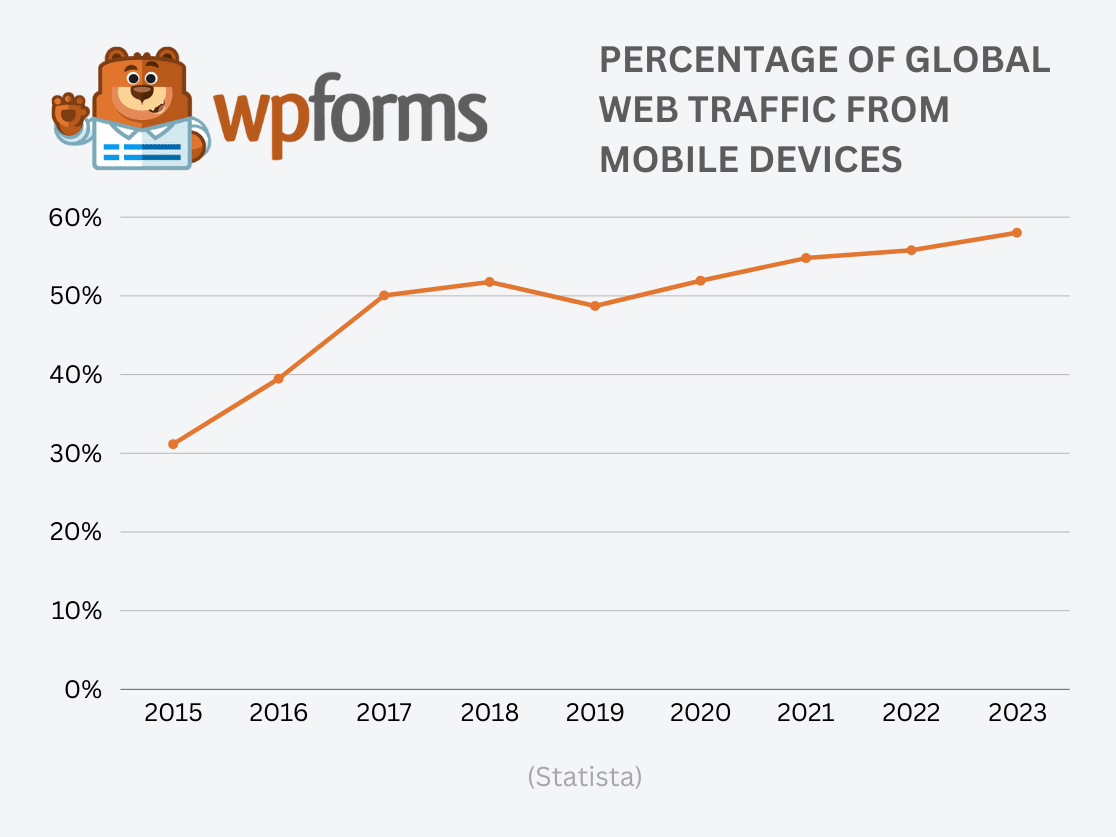
29. Despite high open rates on mobile, these devices see only 18% of email clicks. (Mailchimp)
30. Almost 36% of all spam emails are marketing and advertising related. (Mailmodo)
We’ve got even more email marketing statistics for you to check out if you want to see more.
Social Selling Statistics
The practice of using your social network via social media to discover and nurture relationships with prospects with the goal of converting leads to achieve sales goals is known as social selling. Social networking is an incredibly powerful medium that can be used to drastically improve sales results. For many salespeople, social selling has replaced the sometimes dreaded practice of cold calling.
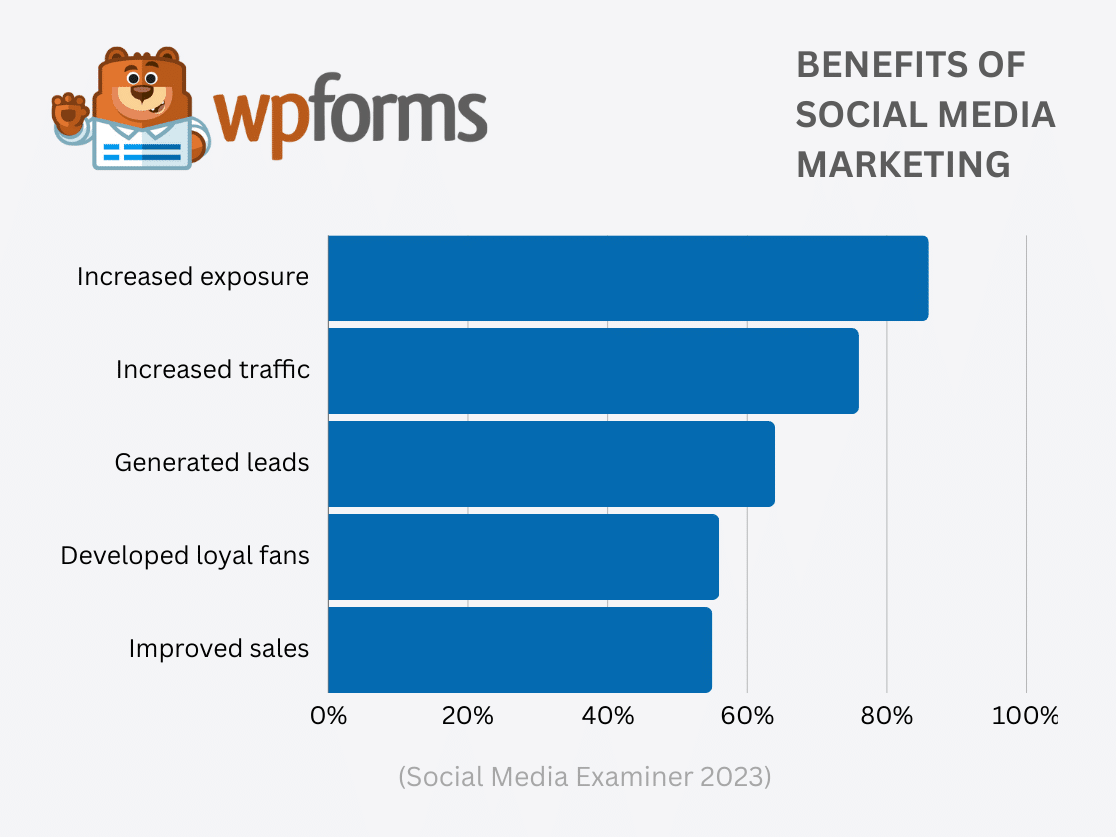
1. The global count of social media users has surpassed 4.95 billion. (Statista)
2. A staggering 93.5% of internet users worldwide interact with social media monthly. (Data Reportal)
3. The social media landscape is witnessing rapid growth, with about 9.6 individuals joining per second. (Data Reportal)
4. The daily time spent on social media by users averages 2 hours and 27 minutes. (Data Reportal)
5. Forecasts suggest social commerce revenues might exceed $1.2 trillion by 2024, with a potential climb to $6.2 trillion by 2030. (Statista)
6. One in four brands has started to engage in direct sales via social media platforms. (Hubspot)
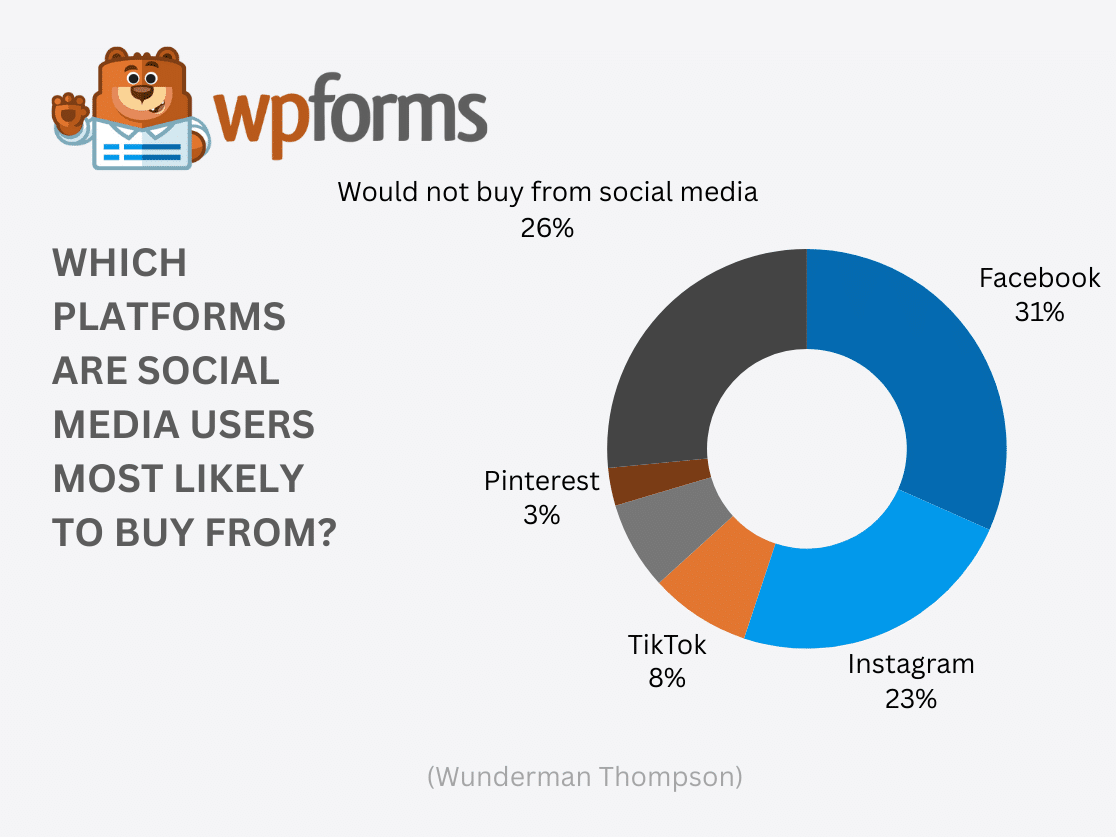
7. Facebook is the preferred shopping platform for 31% of online consumers, while Instagram is more popular among 39% of Gen-Z shoppers. (Wunderman Thompson)
8. More than half of American consumers (53%) make purchases through social media weekly. (Influencer Marketing Factory)
9. Nearly half (43%) of customers discover new products through social networks. (PYMNTS)
10. About 30% of younger generations, including Gen Z and Millennials, have recently made purchases directly through social media. (Hubspot)
11. Social media serves as the primary platform for 35% of Gen Z to follow brands and products. (Hubspot)
12. By 2023, 80% of social media marketers anticipate brands to prominently feature influencers or creators. (Hubspot)
13. In the 18-54 age group, 21% of social media users have been influenced by influencers to make purchases in recent months. (Hubspot)
14. Social media’s lead-to-close rate is double that of traditional outbound marketing methods. (Marketing Essentials Lab)
15. In Q3 2023, Meta reported a substantial revenue of 34 billion U.S. dollars, mainly attributed to advertising. (Statista)
16. A significant 61% of organizations practicing social selling report a beneficial effect on revenue growth. (SalesforLife)
17. Companies focusing on social selling are 51% more likely to achieve their sales goals. (LinkedIn)
18. Nearly half of sales professionals (47%) believe social media generates the highest quality leads, trailing only behind customer referrals. (Hubspot)
Lead Nurturing Statistics
A digital marketers know that their job doesn’t stop at lead generation. These lead nurturing statistics show just how important it is to focus on leads before and after you have them so you can turn them into paying customers.
1. A significant majority of marketers, 85%, believe that customers now expect experiences tailored to their preferences. (Evergage)
2. A notable 83% of consumers are happy to provide personal data in exchange for more customized experiences. (Hubspot)
3. Implementing personalization strategies could slash customer acquisition costs by as much as half. (McKinsey & Company)
4. There’s a rising expectation for personalized interactions among consumers, with 71% expecting such experiences, and 76% feeling frustrated when they don’t occur. (McKinsey & Company)
5. About 78% of brands recognize their struggle with insufficient immediate customer data, impeding their ability to offer relevant personalized experiences. (Experian)
6. Personalized and targeted email campaigns are responsible for generating 58% of all revenue in email marketing. (Instapage)
7. Firms that are proficient in nurturing leads are known to produce 50% more sales-ready leads while reducing costs by 33%. (Adobe)
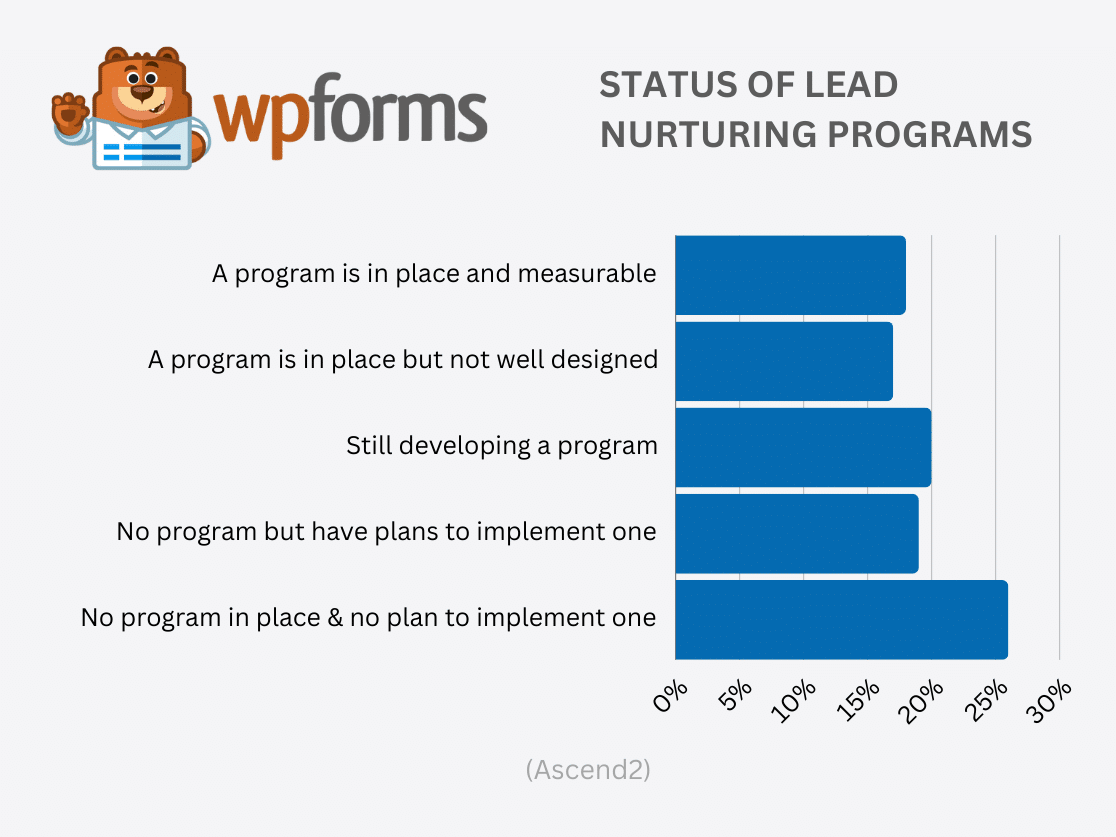
8. Approximately 26% of marketing professionals lack a formal strategy for nurturing leads and have no plans to implement one. (Ascend2)
9. Enhancing customer retention and engagement are considered top priorities in lead nurturing programs by 43% of marketers. (Ascend2)
10. For 56% of marketing experts, targeted content is the most critical component of a lead generation program, with timely follow-ups and personalization also seen as vital by 49%. (Ascend2)
11. A considerable 80% of marketing professionals believe that automation software plays a crucial role in enhancing lead nurturing performance. (Ascend2)
12. Allocating more resources and time to lead nurturing is viewed by 84% of marketers as a strategy that could significantly improve conversion rates. (Ascend2)
13. Closing deals with nurtured leads can result in a 47% increase in the order value. (Salesmate)
14. 15% of organizations are incorporating AI tools in their content marketing strategies for generating and nurturing leads. (Content Marketing Institute)
eCommerce and Online Shopping Statistics
You can’t have a list of small business digital marketing statistics or online business statistics without including eCommerce statistics. eCommerce, which is commercial transactions that take place electronically over the internet, continues to grow like crazy.
1. Over 2.14 billion individuals globally shop online – 27% of the global population. (Tidio)
2. Forecasts suggest that the worldwide eCommerce sector could surpass $8 trillion by 2027. (Statista)
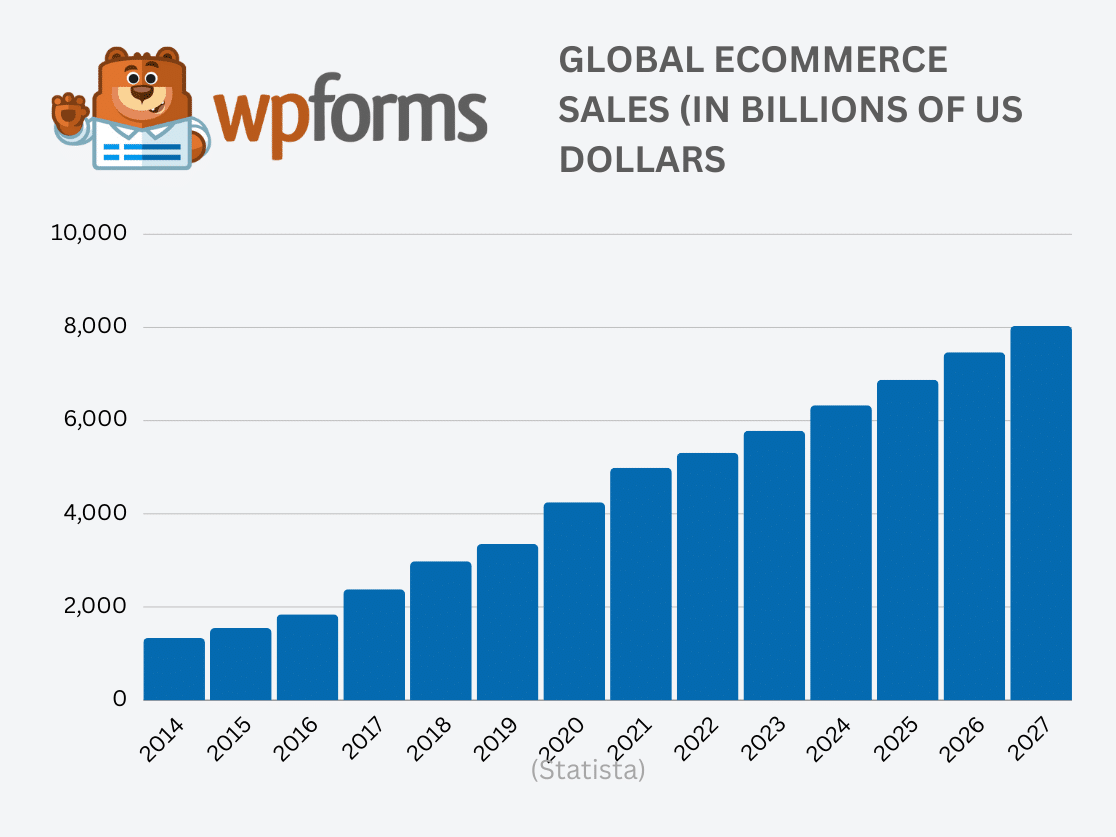
3. The annual growth rate of eCommerce sales is expected to reach 10.1% by 2024, significantly outpacing the 2% growth projected for physical store sales. (eMarketer)
4. Currently, online retail constitutes 20% of total retail sales, with expectations to increase to 25% by 2025. (Tidio)
5. Projections indicate that by 2040, a vast majority (95%) of purchases will be conducted online. (Instapage)
6. 56% of consumers favor online shopping for its 24/7 availability. (Statista)
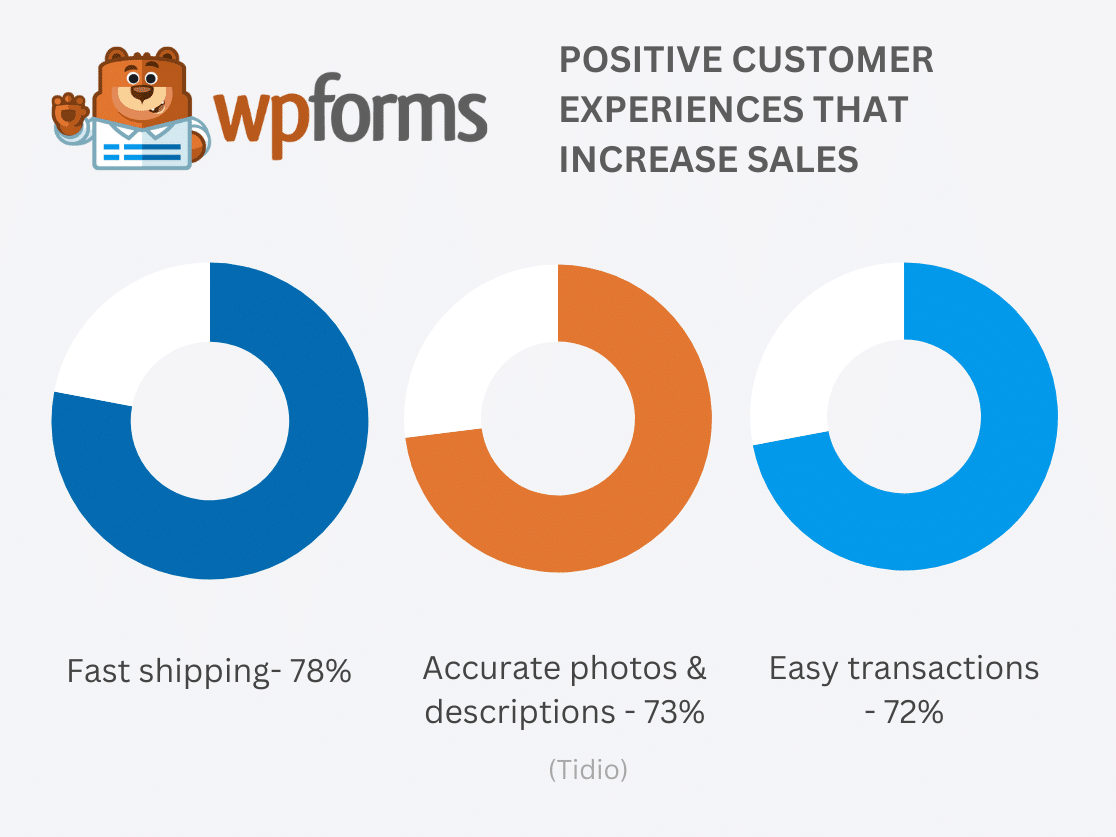
7. Quick shipping and delivery are key to 78% of online shoppers, making it their primary purchase consideration, followed closely by product description accuracy (73%) and ease of purchase process (72%). (Tidio)
8. Nearly half of Gen Z consumers (46%) would spend more for the opportunity to shop in their favorite online stores. (Tidio)
9. Weekly social media shopping is a habit for 53% of American consumers. (Influencer Marketing Factory)
10. A significant portion of shoppers, 46%, would switch retailers to ensure product availability. (Insider Intelligence)
11. Amazon leads the global eCommerce market, drawing over 13% of desktop traffic, quadruple that of eBay. (Statista)
12. The global count of online stores has reached over 12 million. (Tidio)
13. The value of the livestream e-commerce market is projected to hit around $50 billion by the end of 2023. (Influencer Marketing Factory)
14. Top-selling eCommerce products encompass a range including clothing, footwear, electronics, books, and beauty products. (Mailchimp)
15. The average rate at which eCommerce browsers convert to buyers is 3.65%. (Adobe)
16. On average, a global customer’s annual expenditure online is around $2,310. (Tidio)
17. By 2025, the revenue generated through conversational marketing in e-commerce is expected to reach $290 billion. (Statista)
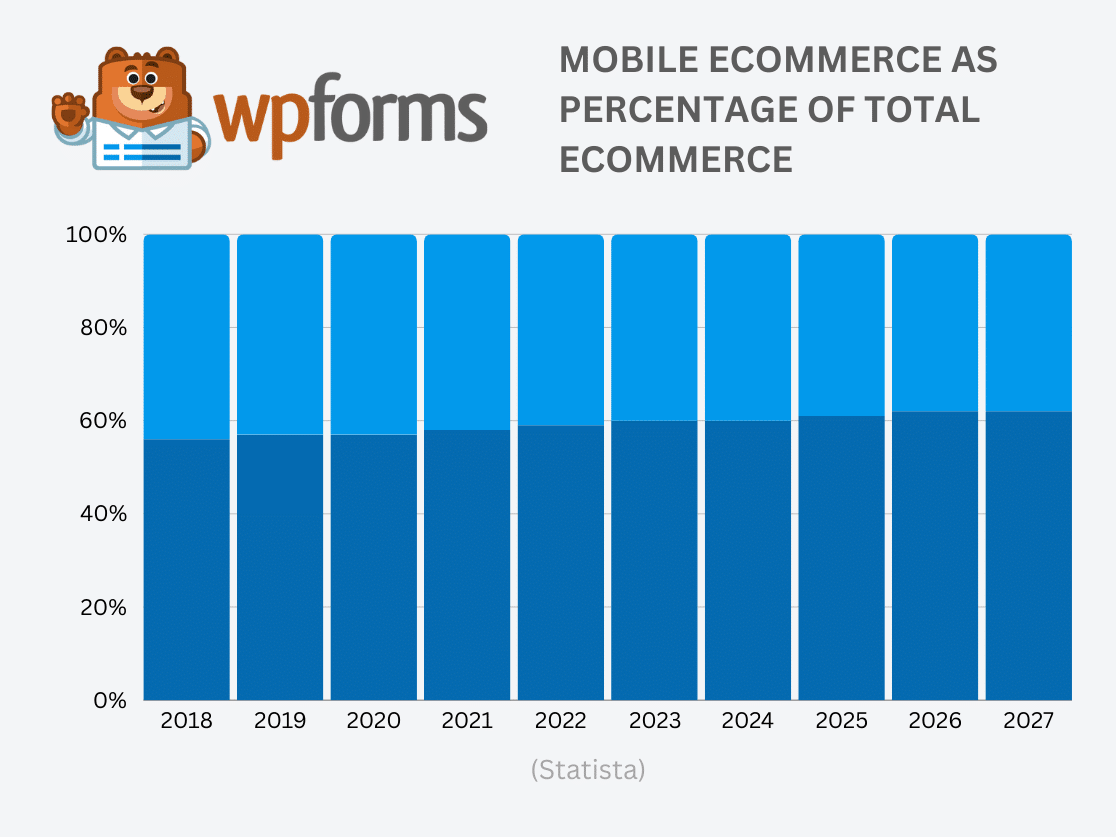
18. In 2023, mobile commerce accounted for 43.3% of all eCommerce sales, showing an increase from the previous year’s 41.8%. (Insider Intelligence)
19. The cross-border eCommerce sector is set to expand by an impressive 108% from 2023 to 2028. (Juniper Research)
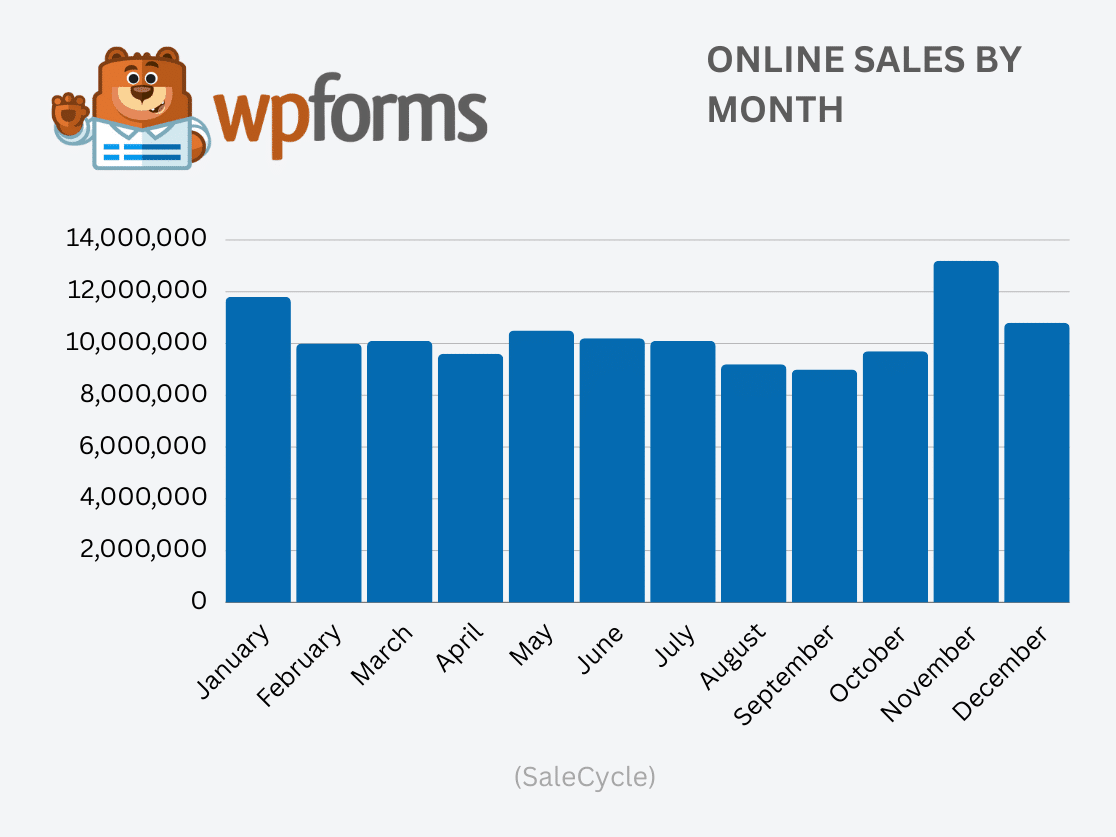
20. November sees sales increase by 12% to 140% more than other months, with the lowest online sales occurring in the summer. (SaleCycle)
21. Amazon sold over 300 million items worldwide during Prime Day 2022. (Amazon)
22. In countries where Amazon is well-established, 60% of shoppers use it for product searches. (Wunderman Thompson)
23. Online sales peak during the 25th – 28th of the month, correlating with most companies’ payday periods. (SaleCycle)
24. Holiday sales account for 20% of all retail sales. (OptinMonster)
25. In 2022, 5% of online purchases in the US were made with buy now, pay later payment options. (Statista)
26. Around 60% of Gen-Z and Millennials prefer to buy products from small businesses. (Hubspot)
27. A third of online shoppers enjoy online “window shopping” for fun. (Visual Objects)
28. 82% of consumers want brands to share their personal values. (Consumer Goods Technology)
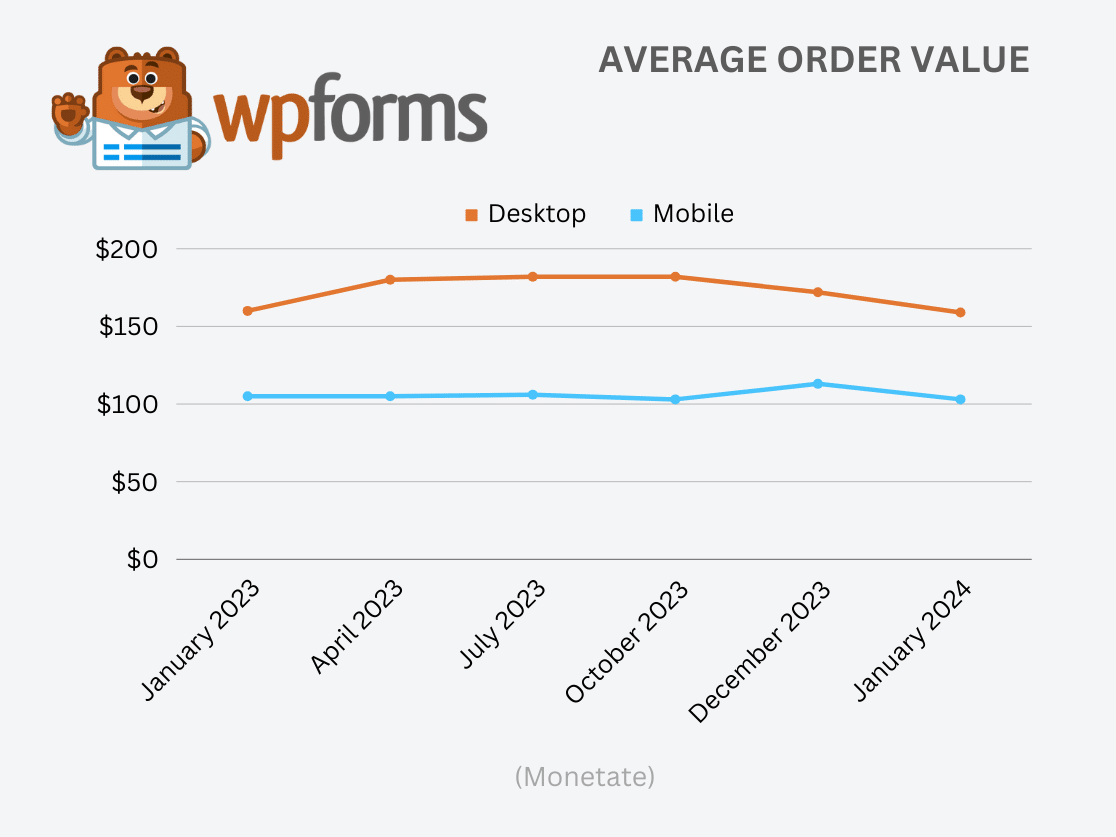
28. On average, people spend about $155.75 when shopping online via computer, compared to just over $112 on mobile. (Tidio)
29. 57% of US shoppers buy Christmas presents online. (Tidio)
30. 35% of consumers would shop for clothes online more if virtual try-on was available. (BigCommerce)
31. Fast shipping and delivery are the most important factors for 78% of frequent online shoppers. (Tidio)
Mobile Commerce Statistics
Mobile eCommerce, also known as mCommerce or mobile commerce, refers to online research and purchasing using mobile devices such as smartphones, tablets, or laptops. This type of shopping-on-the-go eCommerce is convenient for both consumers and retailers and has massive potential for your business online since it lets you reach your audience anywhere at any time.
1. The mobile eCommerce market is valued at $2.2 trillion, expected to reach 52% of the market by 2027. (Statista)
2. 73% of shoppers using a mobile device will switch from a poorly designed mobile site to one that facilitates easier purchasing. (Zendesk)
3. 28% of US consumers use their phones during in-store shopping for discounts and product information. (PYMNTS)
4. 29% of Americans make purchases on their smartphones at least once per week. (Exploding Topics)
5. 71% of US adults buy products online using their mobile phones. (Vorhaus)
6. 95% of young people aged 13-17 own a phone, and most get their first phone at age 11. (ConsumerAffairs)
7. 46% of shoppers prefer doing product research on a mobile device. (Tidio)
8. 88% of time spent on mobile devices is on apps. (BigCommerce)
9. 70% of mobile sales are made via shopping apps. (BigCommerce)
10. There are an estimated 187 million active mCommerce shoppers in the US. (Tidio)
11. Average order value on mobile is $90 – $110 compared to $140-$175 on desktop. (Monetate)
12. Cart abandonment rate is higher on mobile devices, averaging 85.65%. (Hotjar)
13. 48.2% of online shoppers prefer shipment notifications via text rather than email. (Mailjet)
14. One in ten people who receive a text message clicks, leading to a 16.9% increase in orders. (Omnisend)
15. 68% of shoppers browse on mobile, and 56% of online sales are completed on mobile. (SaleCycle)
Social Proof Statistics:
Social proof is a psychological phenomenon where people conform to the actions of others by having the assumption that those actions are reflective of good behavior. And there are a ton of ways how social proof can improve your brand presence, including as a tactic for conversion rate optimization. If you’re unsure how to use social proof, make sure to check out our post with social proof examples.
1. Showing customer reviews on a brand’s website can lead to an increase in conversion rates, potentially by as much as 20%. (Power Reviews)
2. Almost all online shoppers, over 99.9%, engage in reading reviews during their shopping process. (PowerReviews)
3. Nearly half of the consumer population, 49%, places as much trust in online reviews as they do in personal recommendations from their network. (Brightlocal)
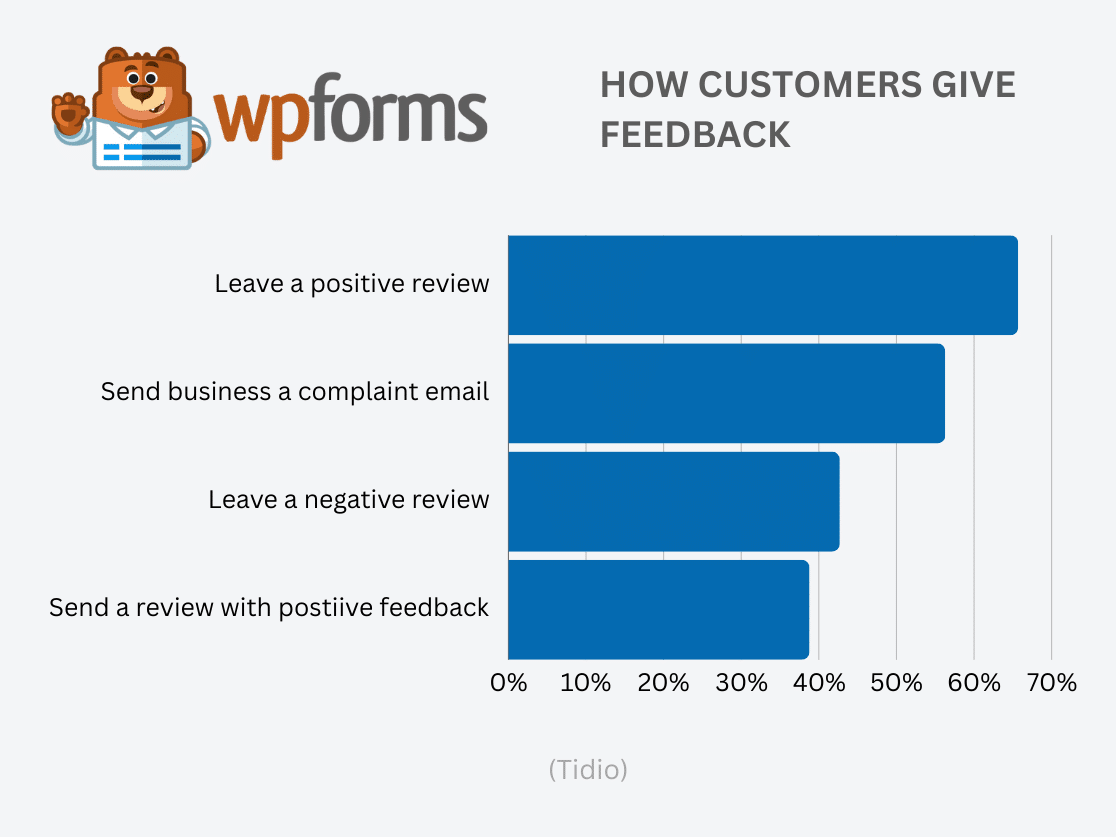
4. Positive shopping experiences prompt 66% of U.S. customers to write favorable reviews. (Tidio)
5. Review submission increases from 12% to 26% when customers are incentivized, such as through discount codes. (Tidio)
6. For well-known brands, consumers usually read between 3 to 5 reviews, while for less familiar brands, the number rises to between 5 to 10. (Yotpo)
7. A vast majority, 85%, of consumers expect a product to have between 50 to 500 reviews. (Yotpo)
8. Products with more than 50 reviews can see a conversion rate boost of approximately 4.6%. (BigCommerce)
9. 52% of businesses observe a loyalty increase from online reviews, with 53% noting higher in-store sales, and 63% experiencing improved SEO. (Bazaar Voice)
10. A significant 89% of marketers that invested in influencer marketing intend to sustain or increase their investment. (Hubspot)
11. About 28% of younger generations, specifically Gen-Z and millennials, have made direct purchases via social media platforms in recent months. (Hubspot)
12. 49% of Gen Z say they’re less likely to make a purchase and 27% say they’ll stop shopping with the brand or share the negative experience with friends or family after an impersonal experience with a brand. (Twilio Segment)
13. The market size for global influencer marketing has surpassed the $21 billion mark. (Statista)
14. Over half of Gen-Z, at 55%, state that their purchasing decisions are most influenced by recommendations from influencers. (Hubspot)
15. Influencer recommendations have swayed 21% of social media users in the 18-54 age range to make purchases in the last three months. (Hubspot)
Email Subject Line Statistics
Wondering which email subjects gets the most open rates? Overall, subject lines that are personalized based on what they know their recipients are interested in perform the best.
1. 32% of email marketers use AI to assist in writing subject lines. (Litmus)
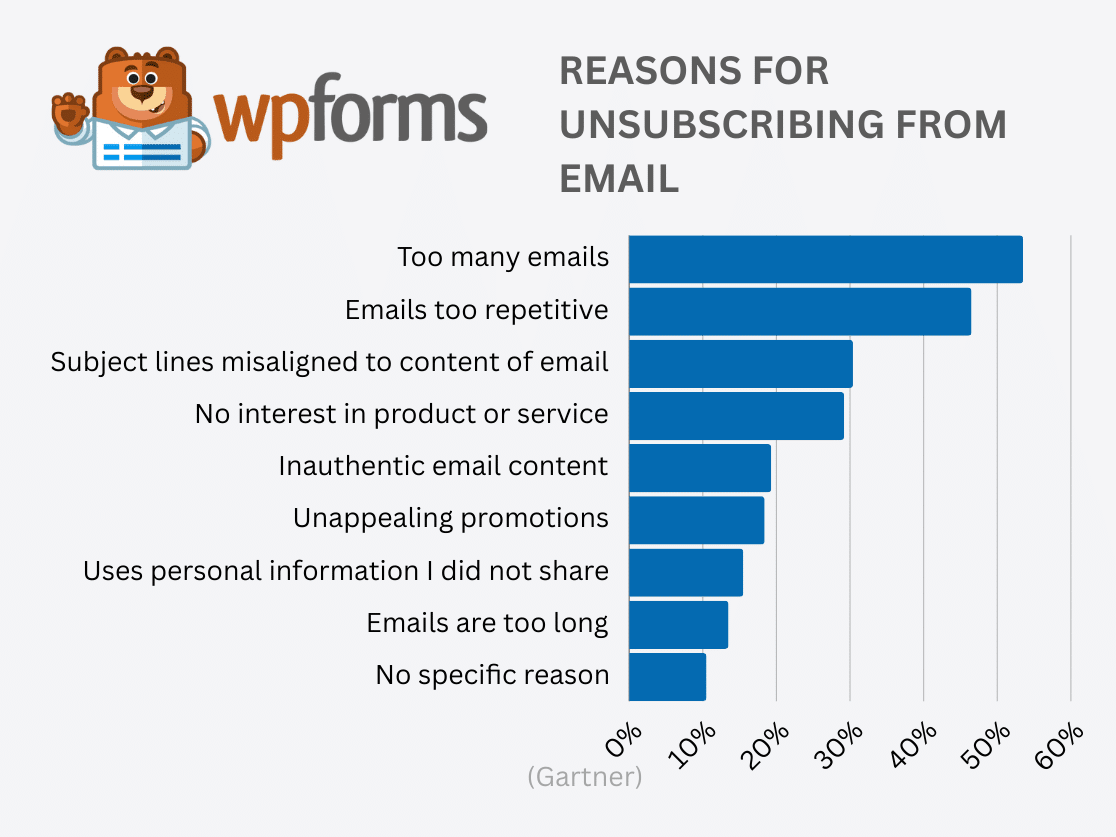
2. Over 30% of people say they unsubscribed from an email because the subject line was not aligned with the content of the emails. (Gartner)
3. 31% of brands use personalized email subject lines. (Gartner)
4. Readers are 26% more likely to open emails with personalized subject lines. (Campaign Monitor)
5. 69% of email recipients report emails as spam based only on the subject line. (Macorr Research)
6. Brands using emojis in their email subject lines see a 56% increase in open rates. (Campaign Monitor)
7. The average email subject line contains 44 characters. (AWeber)
8. Most mobile email apps display 50-70 characters of the email subject line (Martech Zone)
9. 55% of emails are opened on mobile devices, meaning it’s a good idea to keep email subject lines under 50 characters if possible. (Hubspot)
10. The most effective email subject lines utilize personalization and include promotional offers or are written to engage curiosity. (Hubspot)
11. 47% of marketers test email subject lines to optimize click-through rates. (Hubspot)
12. 33% of email recipients open emails because of a catchy subject line (Finances Online)
13. A/B testing of email subject lines can improve ROI by 28% (Litmus)
14. Adding a preheader to your email subject line increases open rates by an average of 7%. (Campaign Monitor)
15. “Boring” subject lines sometimes perform best, with straightforward newsletter and descriptive subject lines performing the highest of 40 million emails examined in one study, with open rates of 60-87%. (OptinMonster)
16. Emails with numbers or question marks in the subject line have 8% higher open rates on average. (Klenty)
17. Emails with “Free” in the subject line are opened 10% more often. (OptinMonster)
18. Incorporating a recipient’s name in the email subject line can elevate open rates by 10-14%. (OptinMonster)
SEO Statistics
Digital marketers know that Search Engine Optimization (SEO) is one of the most important investments to grow your business online and when done correctly, it can cost very little (besides your time) so you can use your marketing budget for things like ad spend. To many, SEO is an art form that combines content creation, branding, and promotion to bring highly qualified visitors to your website naturally via a search engine. And these SEO statistics show exactly why it’s so important.
1. 68% of online experiences begin with a search engine. (BrightEdge)
2. Google processes 99,000 searches every second, leading to 8.5 billion searches per day and approximately 2 trillion searches per year. (SEO.ai)
3. SEO drives 1,000%+ more traffic than organic social media. (BrightEdge)
4. The top position in Google’s organic search results has an average click-through rate (CTR) of 27.6%. (Backlinko)
5. 29% of marketers use a search-optimized website and blog to attract and convert leads. (Hubspot)
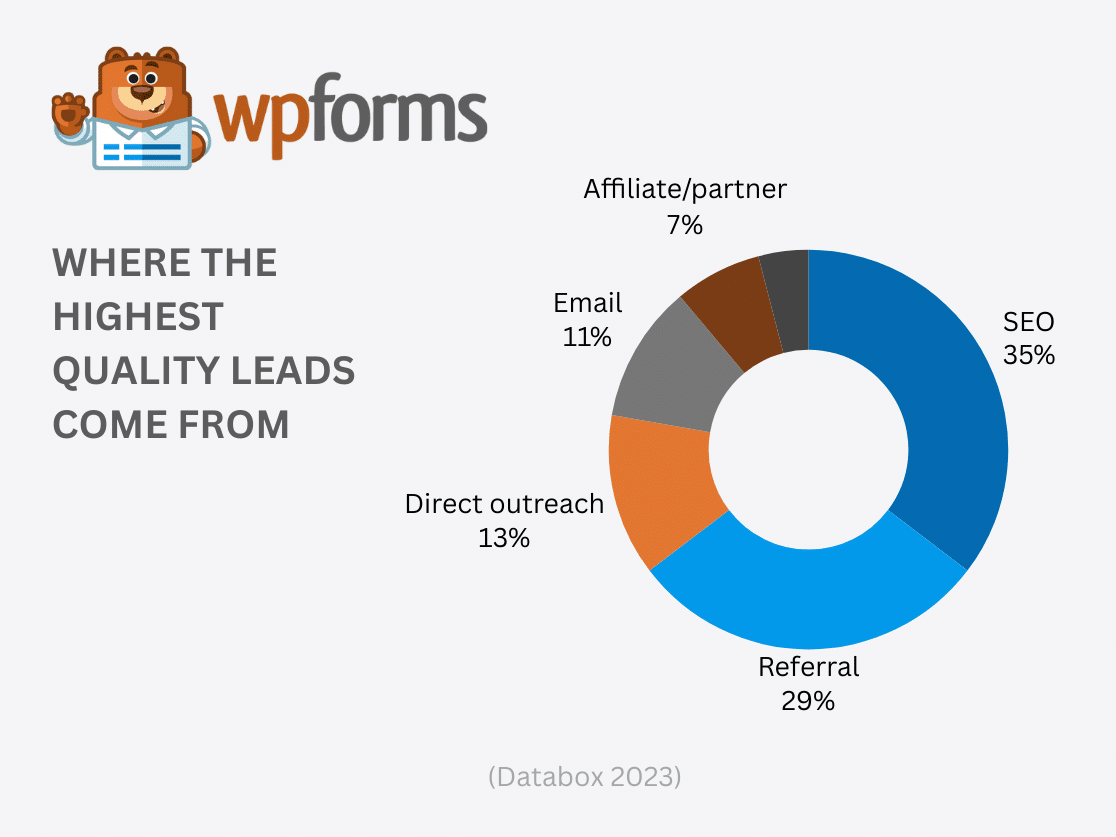
6. SEO is considered the top source of high-scoring leads, with 35% of marketers attributing their most valuable leads to this channel. (Databox)
7. 55% of marketers agree that publishing more content drives higher organic rankings. (SEMRush)
8. Updating and republishing old blog posts with new content and images can more than double organic traffic. (Backlinko)
9. Small businesses with blogs generate 67% more leads than those without. (Demand Metric)
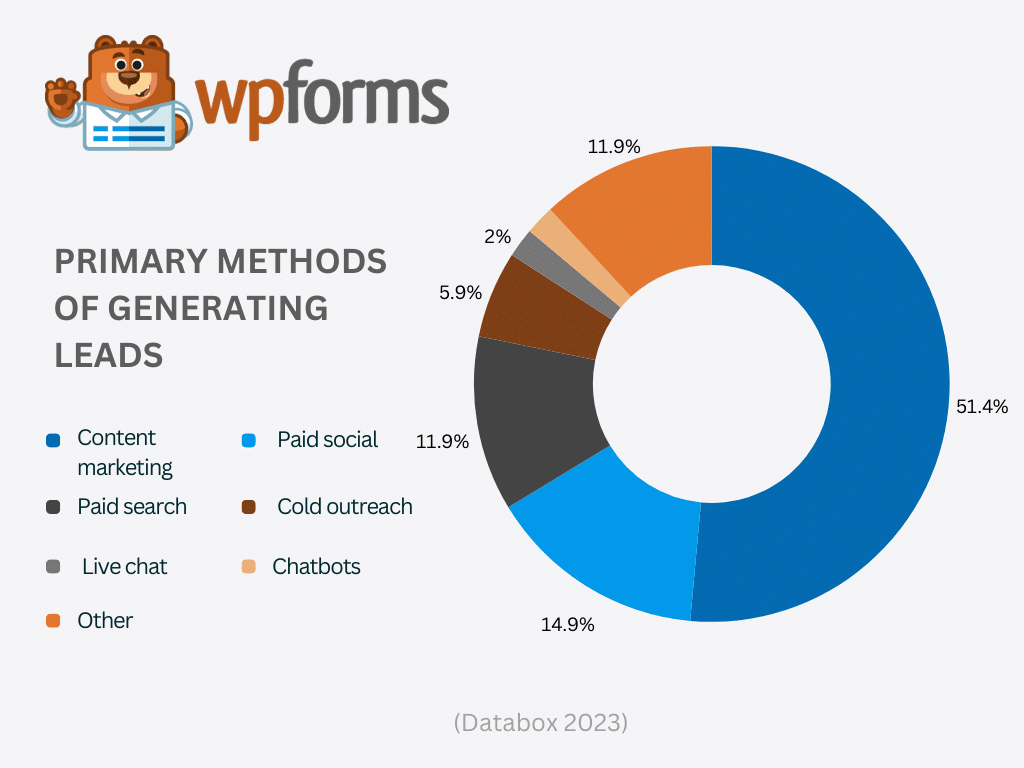
10. Over half of lead acquisition methods are attributed to content marketing, and over 70% of industry professionals believe blogging is most effective in generating leads. (Databox)
11. 51% of companies find updating old content the most efficient content marketing strategy. (G2)
12. Websites with active blogs generate 97% more backlinks than those without. (Business 2 Community)
13. 88% of marketers using SEO plan to increase or maintain their investment this year. (Hubspot)
14. 54% of SEO specialists use AI and automation in their roles. (Hubspot)
15. 37% of marketers use AI to automate time-consuming SEO tasks, indicating a trend towards more automated SEO processes. (Hubspot)
16. 84% of bloggers say AI has impacted their SEO strategy, showing the growing influence of technology in content creation and optimization. (Hubspot)
17. SEO leads are 8x more likely to close than those generated by traditional marketing. (Web FX)
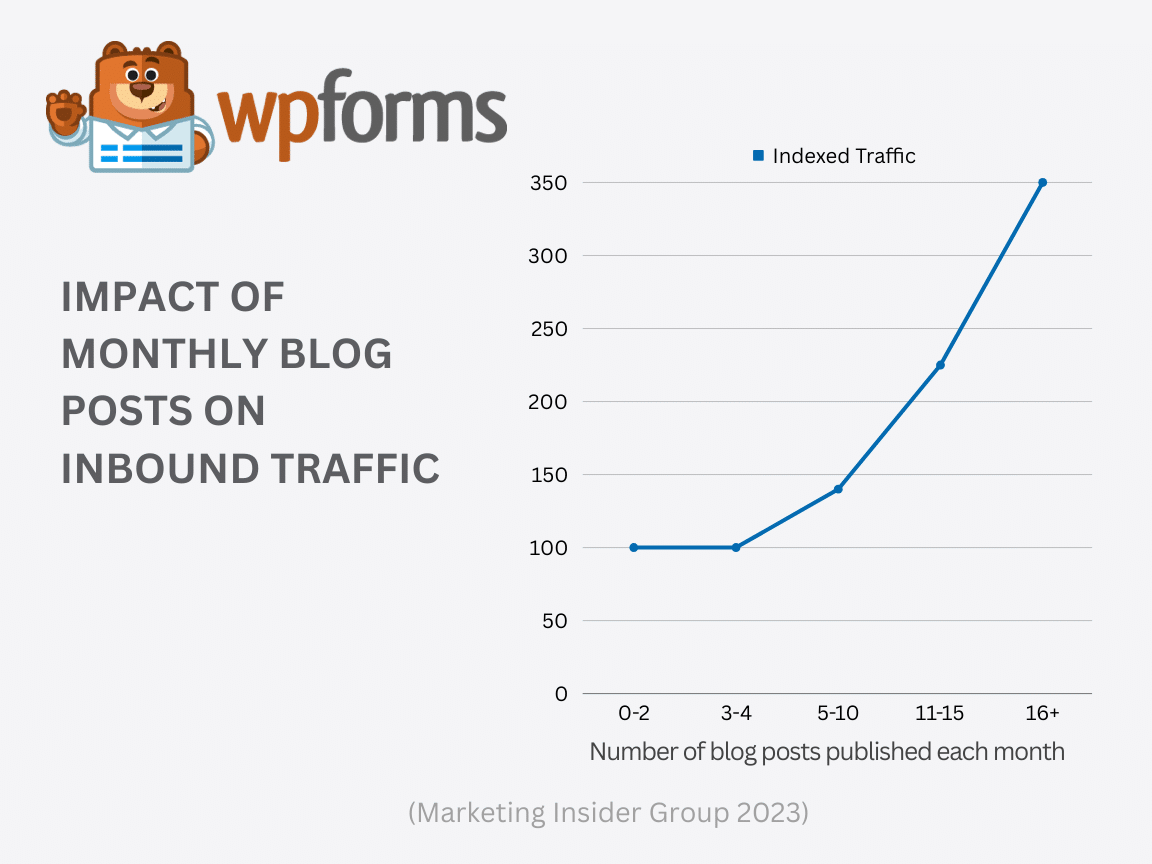
18. Companies that publish posts 4 times a week generate 4.5x more leads than those that only publish once a week. (Marketing Insider Group)
19 56% of consumers most often use a mobile device for search engines, compared to 29% using a desktop. (Hubspot)
20. 44% of online shoppers have discovered new products in the last 3 months by searching the internet. (Hubspot)
Conversion Rate Optimization Statistics
Conversion rate optimization (CRO) is the process of boosting the percentage of your site visitors who take a desired action — like completing a form, subscribing to a newsletter, or making a purchase. Marketers spend a lot of time getting people to come to our website, but it turns out getting traffic isn’t a huge problem for most marketers — a weak conversion rate is. A great first step in CRO is to make sure you’re following form conversion best practices.
1. The average conversion rate for paid search landing pages across all industries is 2.35% (Higher Visibility)
2. The top 10% of landing pages have a conversion rate of 11.45% or above. (Higher Visibility)
3. The highest conversion rates are seen in catering and restaurants, and media and entertainment at over 18% on average. Industries with the lowest average conversion rates include home improvement (7.2%), medical services (7.4%), and real estate (7.4%). (Unbounce)
4. Title tags with 40 to 60 characters have an 8.9% higher CTR. (Higher Visibility)
5. Businesses with over 40 landing pages generate 12 times more leads than those with 1 to 5 landing pages. (Higher Visibility)
6. Dynamic calls-to-action (CTAs) convert 202% better. (Higher Visibility)
7. 60% of companies perform landing page A/B tests. (99 Firms)
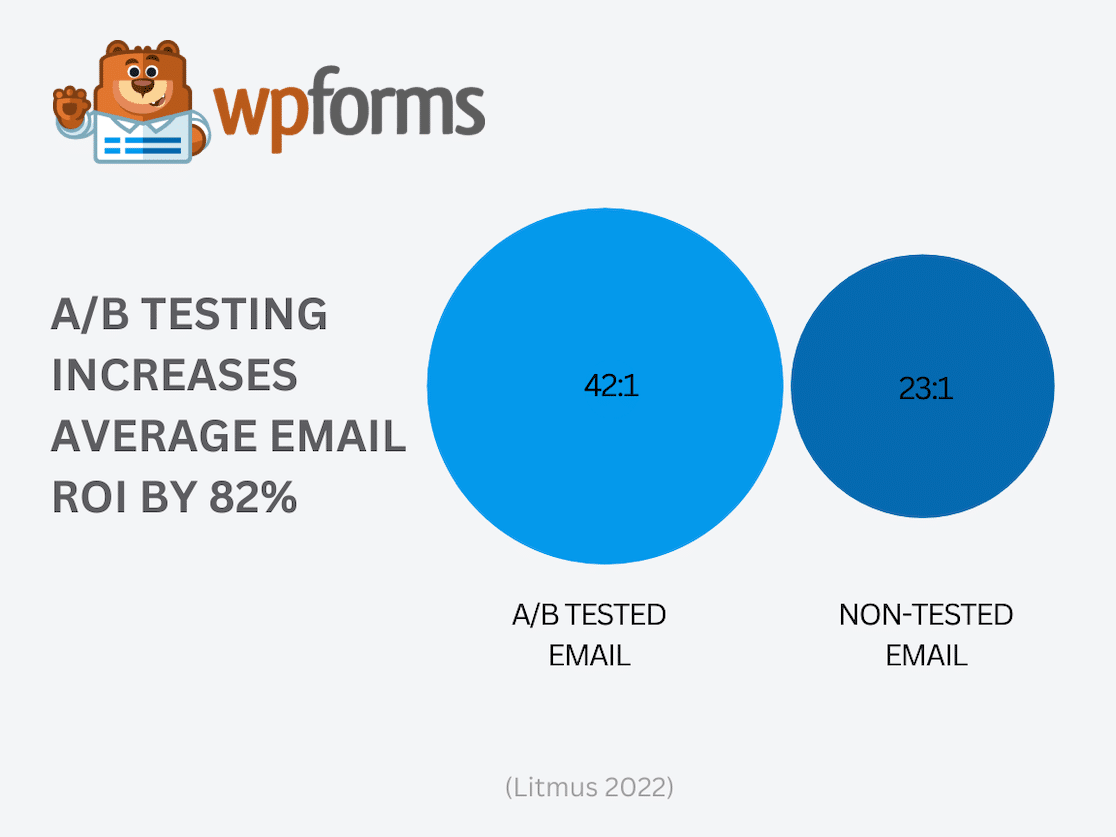
8. Regularly running A/B tests on emails improves ROI by an average of 82%. (Litmus)
8. Even small changes can have a massive impact on your conversion rates—sometimes by as much as 300%. (Leadpages)
9. The average conversion rate for Google Ads in 2023 is 7.04%. (Wordstream)
10. Only 10% of marketing teams have a dedicated CRO budget and over 30% don’t allocate budget to optimization at all. (CXL)
11. Digital analytics is considered to be the most effective CRO tactic, with marketers rating it over 80% effective. Other popular tactics include A/B testing, UX/design, and copywriting. (CXL)
12. Most CRO practitioners (47%) run 1-2 CRO tests per month. (CXL)
13. Optimizers still focus mainly on desktop website optimization, with only around 9% of teams optimizing for mobile apps. (CXL)
14. Better processes is cited as the biggest challenge by CROs, with almost a quarter agreeing this is a major challenge. Buy-in from decision makers and lack of human resources are also common blockers. (CXL)
15. Cross-selling modules are one of the most effective CRO features, used by 100% of the top-performing retailers examined in a study. (Inflow)
16. Only 29% of marketers are optimizing to actual conversion value or customer lifetime. (Marin)
17. 68% of B2B marketers report Google Analytics or another web-based analytics tool is their primary source of data for optimization. (Marin)
18. 79% of CMOs said they will invest more in conversion rate optimization this year. (Wynter)
FOMO Statistics
The acronym FOMO stands for Fear of Missing Out, and it’s one of the most incredibly powerful digital marketing strategies around. It was made popular by online tools like TrustPulse. FOMO is characterized by the desire to stay continually connected with what others are doing, with fear that they are missing out on having rewarding experiences.
1. 70% of millennials experience FOMO on a regular basis. (GWI)
2. The average social media user spends 151 minutes browsing social media platforms each day. (Statista)
3. 56% of people are afraid of missing out on events, news and important status updates if they are away from social networks. (OptinMonster)
4. 31% of Americans feel they are missing out on fun activities that others are doing. (CBS News)
5. 26% of adults under 35 say social media makes them more likely to feel like they’re missing out. (CBS News)
6. A study of 1,000 students found they want to use social media platforms significantly more when their peers also use them. TikTok usage was valued 33% higher among peers, while Instagram was valued 24% higher. (Search Engine Journal)
7. People with household incomes of above $75,000 a year are the most likely to experience FOMO and are also more likely to share experiences on social media with the intent of inciting envy in others. (OptinMonster)
8. 49% of fashion purchases are triggered by pressure from social media. (Tower)
9. Travel posts are the content that is most likely to cause FOMO, with 59% of Millennials admitting they feel a sense of FOMO after viewing them. Events and parties (56%) and food (29%) are also common FOMO-causing content. (OptinMonster)
10. 52% of US adults check their social media accounts as soon as they wake up. (Sleep Foundation)
11. Facebook is the social media platform that causes the most anxiety, with over 21% of social media users admitting the FOMO they experience from bedtime scrolling makes it more difficult for them to sleep. (Sleep Foundation)
12. Almost 28% of users use social media for inspiration on things to do and buy. (Oberlo)
13. 18% of social media users aged 18 to 29 use social media posts for vacation inspiration. (Statista)
14. 61% of people aged 18 to 29 would quit their jobs to become social media influencers. (Izea)
15. Over 30% of Gen Z and millennials said the main reason they overspent with their wealthier friends was because they didn’t want to feel left out. (Business Insider)
16. 48% of millennials have gone into debt to keep up with their friends. (Credit Karma)
17. Email subject lines that use FOMO marketing tactics have a 22% higher open rate. (Emma)
AI in Digital Marketing Statistics
Artificial Intelligence (AI) is revolutionizing digital marketing, offering unprecedented capabilities for personalization, analytics, and automation. With the help of AI, you can tailor content to individual preferences, improve your SEO strategy, and optimize your campaigns for maximum engagement and conversion.
1. 55% of senior executives in leading global sales and marketing organizations believe AI will have a significant impact on marketing optimization such as A/B testing and SEO strategies (McKinsey & Company)
2. 97% of leaders agree artificial intelligence (AI) and machine learning (ML) will enable companies to analyze social media data and insights more efficiently. (Sprout Social)
3. The most popular type of AI used by marketers is Chatbots (used by 53%), text generation tools (44%), visual tools (44%), and audio tools (33%) (Hubspot)
4. 84% of bloggers/SEOs say AI and automation have impacted their SEO strategy for 2023 (Hubspot)
5. 84% of Marketers say that AI and automation are very effective at aligning web content with search intent, 80% for improving the user experience on their site, and 74% for raising their SERP ranking (Hubspot)
6. 45% of marketers use AI to create content, 20% to create copy. (Hubspot)
7. Marketers using generative AI to make content save an average of 3+ hours per piece. (Hubspot)
8. 96% of the time AI content is not complete enough to publish on its own. (Hubspot)
9. 31% of marketers use AI to create social media posts. (Hubspot)
10. 92% of businesses are using AI-driven personalization to drive growth in their business (Twilio Segment)
11. 61% of salespeople believe generative AI will help them better serve their customers (Salesforce)
12. 84% of salespeople using generative AI say it helps increase sales at their organization by enhancing and speeding up customer interactions. (Salesforce)
13. 51% of marketers believe that AI enhances the effectiveness of email marketing over traditional methods. (Statista)
And there you have it, folks! Hopefully, this list of digital marketing statistics helped give you some insight into what’s going on in the world of online marketing and how you can leverage different strategies for your own business.
Next, Collect Leads With WPForms
Now that you have tons of digital marketing inspiration, it’s time to take your WordPress site to the next level so you can convert all that traffic into leads and sales.
One of the most effective ways you can grow your website and get subscribers is to use contact forms. WPForms Pro is the best way to do that because:
- WPForms comes with a powerful and intuitive drag and drop form builder, making it easy for users of all skill levels to create custom forms quickly, without needing to write any code.
- The plugin includes 2,000+ WordPress form templates for different purposes, including lead capture forms, which can save time and effort in setting up forms that are optimized for conversion.
- You can sell digital products on your WordPress site and instantly send a download link to your customer
- WPForms integrates with popular email marketing services like Mailchimp, AWeber, Constant Contact, and more, allowing you to automatically add new leads to your email lists and segment them based on their interests or actions.
- WPForms integrates with payment providers like PayPal and Stripe, allowing you to collect payments as part of the form submission process.
- As well as the main plugin, you can extend the funtionality of WPForms with powerful addons including the Lead Forms addon, which is designed to create high-converting forms to collect as many leads as possible.
- WPForms Pro includes conditional logic, enabling you to create dynamic forms that change based on user input. This can help in creating a more personalized and effective lead capture process.
- WPForms is backed by extensive documentation and a supportive customer service team, providing help and guidance to ensure you can maximize the effectiveness of your lead generation efforts.
- All of your forms will be fully mobile responsive, so you can use your WordPress site for mobile eCommerce and mobile lead generation too.
Create Your WordPress Form Now
Focusing on getting more email subscribers is always a good place to start with your digital marketing efforts. Be sure to check out our post on how to grow your email list for some awesome tips.
Ready to build your form? Get started today with the easiest WordPress form builder plugin. WPForms Pro includes lots of free templates and offers a 14-day money-back guarantee.
If this article helped you out, please follow us on Facebook and Twitter for more free WordPress tutorials and guides.



This was a really interesting read! The stats show just how powerful digital marketing has become. It’s amazing how quickly things are shifting toward online strategies. The insights on the impact of social media and video marketing were especially eye-opening. Thanks for sharing these valuable trends!
Glad you found it helpful🙂
Digital Marketing Statistics are very useful thanks
Glad you found it helpful🙂