AI Summary
When I first started with email marketing, it quickly became clear that tracking the right metrics was essential to making my campaigns successful.
Each email I sent out could reach a huge number of people, but what mattered was understanding what worked and what didn’t.
Over time, I learned that certain metrics are extremely important to figuring out if your emails are actually engaging your audience.
In this guide, I’ll walk you through the most important email marketing metrics, showing you how each one can help you make smarter decisions.
1. Open Rate
Your email’s open rate is the percentage of people who have opened your email. This email marketing metric helps you determine whether your subject line was successful in getting the reader’s attention.
Many email providers, including Gmail, will scan your emails before the reader even sees them. Your email marketing service might count this automated scan as an ‘open’, even though the email was never seen by a human.
The intention behind this is good. Services like Gmail want to filter out spam before you see it. Gmail might also direct your email to a specific folder or tab, which means it needs to analyze the content first.
But for marketing, that makes open rates difficult to measure. You can, however, use a formula like the one below to calculate your open rates.
Open rate = (number of emails opened / number of emails delivered) x 100
Bear in mind that if you use any of the top email service providers on the market today, they have already calculated your email open rates for you.
2. Click to Open Rate (CTOR)
Click-to-Open Rate (CTOR) is one of those metrics that really shows how engaging your email content is. While the open rate tells you how many people opened your email, CTOR digs a little deeper.
It tells you what percentage of those who opened the email actually clicked on a link. This is a great way to measure whether your email content resonates with your audience and encourages action.
To calculate CTOR, use this formula:
CTOR = (Total Clicks / Unique Opens) x 100
So, if you sent out an email that was opened by 200 people, and 50 of them clicked a link, your CTOR would be 25%. A high CTOR suggests that your content and call-to-action are working well together,
On the other hand, a lower CTOR might mean you need to make your content more appealing or tweak your call-to-action to grab attention better.
3. Click Through Rate (CTR)
Clickthrough rate is simply the number of people who clicked on a link in your emails. If you’re not sure what to measure, start here. This one is easy to understand. It’s also easy to see over time whether the percentage goes up or down.
To calculate CTR, use this formula:
CTR = (Total Clicks / Total Emails Sent) x 100
For example, if I sent an email to 1,000 people and 50 of them clicked a link, my CTR would be 5%.
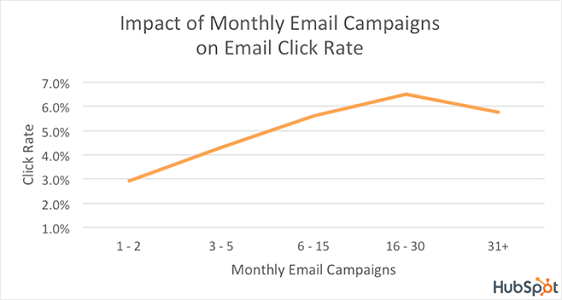
According to HubSpot, companies that send 16-30 email campaigns a month see a clickthrough rate that’s 2x greater than those sending out fewer than 2 campaigns a month.
Keep in mind, these statistics refer to targeted email campaigns sent to a particular group of people, not an email blast to everyone on your email list.
If your clickthrough rate is low, you should start split testing your email campaigns to pinpoint why people are opening your emails but not clicking on the links.
You can A/B test things like:
- Email subject lines
- Format, especially when it comes to mobile layouts
- Fonts, colors, images, and branding
- Length and content format
- Call to action button copy, color, and location
There are also plenty of other email marketing campaign elements you can test and track as an email metric:
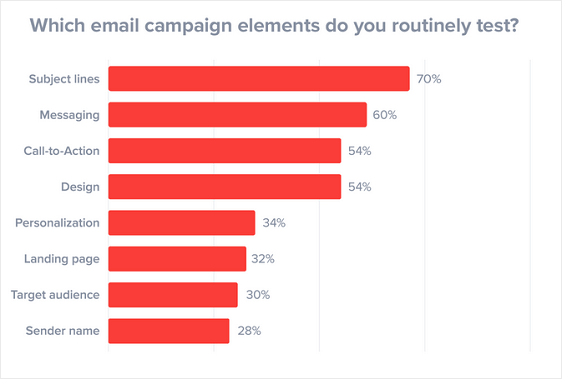
Just remember, only split test one element at a time to make sure you get the most accurate data possible.
If you want some more ways to boost your email clickthrough rates, check out these clever email personalization examples to gain more leads.
4. Conversion Rate (CR)
Your email’s conversion rate measures how many people clicked on a link and went on to complete the desired action.
You might want them to make a purchase or fill out a form. Either way, it’s a conversion if it means the person did what you were hoping they would do.
Here’s the formula to calculate CR:
Conversion Rate (CR) = (Total Conversions / Total Emails Delivered) x 100
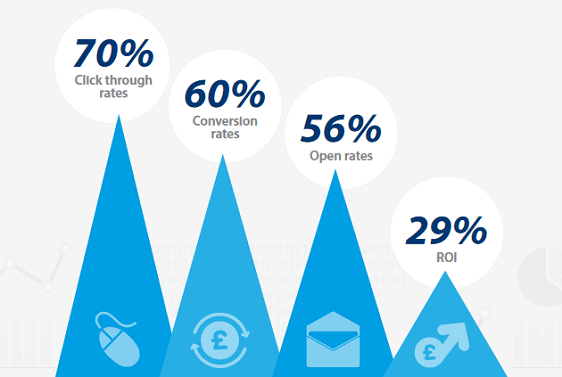
Conversion rate is such an important email marketing metric to track, 60% of marketers claim it’s something they always monitor to determine the progress of their email campaigns.
If your conversion rates are low, make sure the desired action is clear. The best way to do this is to include a button they can click. Make it prominent and choose a contrasting color.
You can also set a deadline to make it more likely that someone will act, or ensure the landing page aligns well with the email content to drive more conversions.
5. Return on Investment (ROI)
ROI lets you know the money you’re spending on campaigns is worth it. Luckily, email marketing is the number one driver of revenue for many businesses.
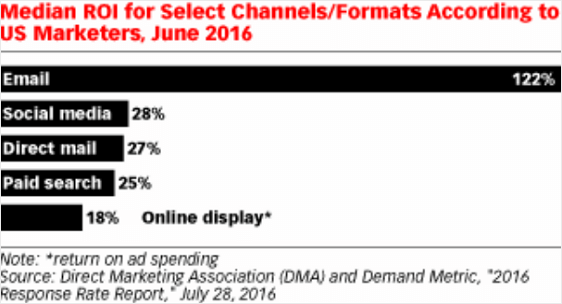
In fact, according to an eMarketer study, email was found to have a median ROI of 122%, which is four times higher than any other type of marketing.
You can calculate your email’s ROI by using this formula:
ROI = (Revenue – Expenditure on Campaign) / (Expenditure on Campaign) * 100
Closely monitoring your emails’ ROIs allows you to see which campaigns are working the best and which ones need improvement.
By doing this, you can make sure your business is profitable. Make sure to also check out these email marketing statistics to learn what matters most when measuring your success.
6. Bounce Rate
Bounce Rate is a metric I keep a close eye on because it tells me how many of my emails didn’t make it to my subscribers’ inboxes.
When it comes to email deliverability, high bounce rates are bad news. Here’s how I calculate the bounce rate:
Bounce Rate = (Total Bounced Emails / Total Emails Sent) x 100
A bounce means that your email provider tried to send a message, but the receiving server rejected it. There can be a variety of reasons for this:
- The email address may be misspelled or may no longer exist
- The recipient’s server might be down
- Your email may be marked as spam.
Of all of these reasons, the last one is the one you need to worry about. Email providers use a combination of factors to measure whether emails are spam, and if you’re falling into that category, there’s something wrong.
- Your SPF, DKIM, and DMARC records may not be configured correctly. If you’re not familiar with these DNS records, check out this guide on how email authentication works.
- Multiple people on your list might be reporting your emails as spam. This may indicate that they didn’t expect to receive emails from you — a red flag for your email provider.
- Your email spam score may be above the threshold that’s needed to trigger a block. Spam scores can be elevated by things like too many links in an email.
- Your domain reputation is poor, which can result from all of the above combined. When domain reputation drops, recovery can be difficult.
If you suspect you have an issue with your spam score or technical email set-up, check out this guide to email deliverability. It walks through all of the factors we talked about so you can review them and decide if they need to be fixed.
7. Unsubscribe Rate
Unsubscribe Rate is a metric I pay close attention to because it shows how many people chose to leave my email list after receiving a campaign.
If I see the unsubscribe rate creeping up, it tells me I might need to adjust my messaging, frequency, or content style to better align with what my subscribers want.
Here’s the simple formula I use to calculate it:
Unsubscribe Rate = (Total Unsubscribes / Total Emails Delivered) x 100
For example, if I send out 1,000 emails and 10 people unsubscribe, my unsubscribe rate would be 1%. Keeping this rate low is essential because it reflects how well I’m retaining my audience.
To manage it, I often review feedback, test different types of content, and ensure that I’m only sending to people genuinely interested in staying connected.
8. Spam Complaint Rate
Spam Complaint Rate is a critical metric that helps email marketers understand how often their emails are marked as spam by recipients.
When someone flags my email as spam, it impacts my sender reputation, which can hurt my deliverability over time.
A high spam complaint rate might mean that my content isn’t resonating well with subscribers or that I’m not targeting the right audience.
To calculate the spam complaint rate, here’s the formula I use:
Spam Complaint Rate = (Spam Complaints / Total Emails Delivered) x 100
For example, if I send 1,000 emails and 5 of them are marked as spam, my spam complaint rate would be 0.5%. Keeping this rate as low as possible is essential, as high complaints can lead to my emails being blocked.
If you’re dealing with a high spam complaint rate, this guide on reducing spam complaints offers practical steps to improve your approach.
Personally, I make sure my emails are sent only to people who have willingly subscribed, and I provide clear unsubscribe options in every email to help reduce complaints.
FAQs about Email Marketing Metrics
Email marketing metrics are a popular topic of interest among our readers. Here are answers to some common queries about it:
What is KPIs in email marketing?
KPIs, or Key Performance Indicators, in email marketing are specific metrics used to measure the effectiveness of your email campaigns.
Common KPIs include open rate, click-through rate (CTR), bounce rate, and conversion rate, which help you assess how well your emails are performing.
How to measure the success of email marketing?
To measure email marketing success, track metrics like open rate, CTR, conversion rate, and unsubscribe rate.
Analyzing these metrics over time shows how engaged your audience is and how effectively your emails drive action.
What is a good CTR for email marketing?
A good click-through rate (CTR) for email marketing typically falls between 2-5%, depending on the industry.
Higher CTRs indicate that your content and calls-to-action resonate well with your subscribers.
Is a 20% email open rate good?
Yes, a 20% open rate is generally considered good in email marketing. It suggests that your subject lines and sender reputation are effective enough to get people to open your emails.
What is an acceptable bounce rate email marketing?
An acceptable bounce rate in email marketing is usually below 2%. Higher bounce rates may indicate issues with your email list, such as outdated or incorrect email addresses.
What is a good conversion rate for email marketing?
A good conversion rate in email marketing often ranges from 2-5%. This means that out of everyone who receives your email, 2-5% take the desired action, like making a purchase or signing up for a service.
Next, Measure Your Form Conversions
Now you’re measuring the success of your emails, don’t forget to track your forms. Form conversion rates can help you to understand whether your website is driving leads and sales.
- Check out how to track form conversions in Google Analytics. This guide is up to date with all the latest tips for GA4.
- Learn how to track your most successful web pages with the WPForms User Journey addon.
Ready to build your form? Get started today with the easiest WordPress form builder plugin. WPForms Pro includes lots of free templates and offers a 14-day money-back guarantee.
If this article helped you out, please follow us on Facebook and Twitter for more free WordPress tutorials and guides.


