AI Summary
When troubleshooting issues with WordPress plugins, themes, or custom code, you may need to enable WordPress debugging. This feature logs any errors detected on your site, helping you identify the source of problems or gather more details about potential issues.
This guide will show you how to safely enable debugging on your WordPress site.
Enabling Debug in WordPress
To enable debugging on your site, please follow the steps below.
1) Locating the wp-config.php file
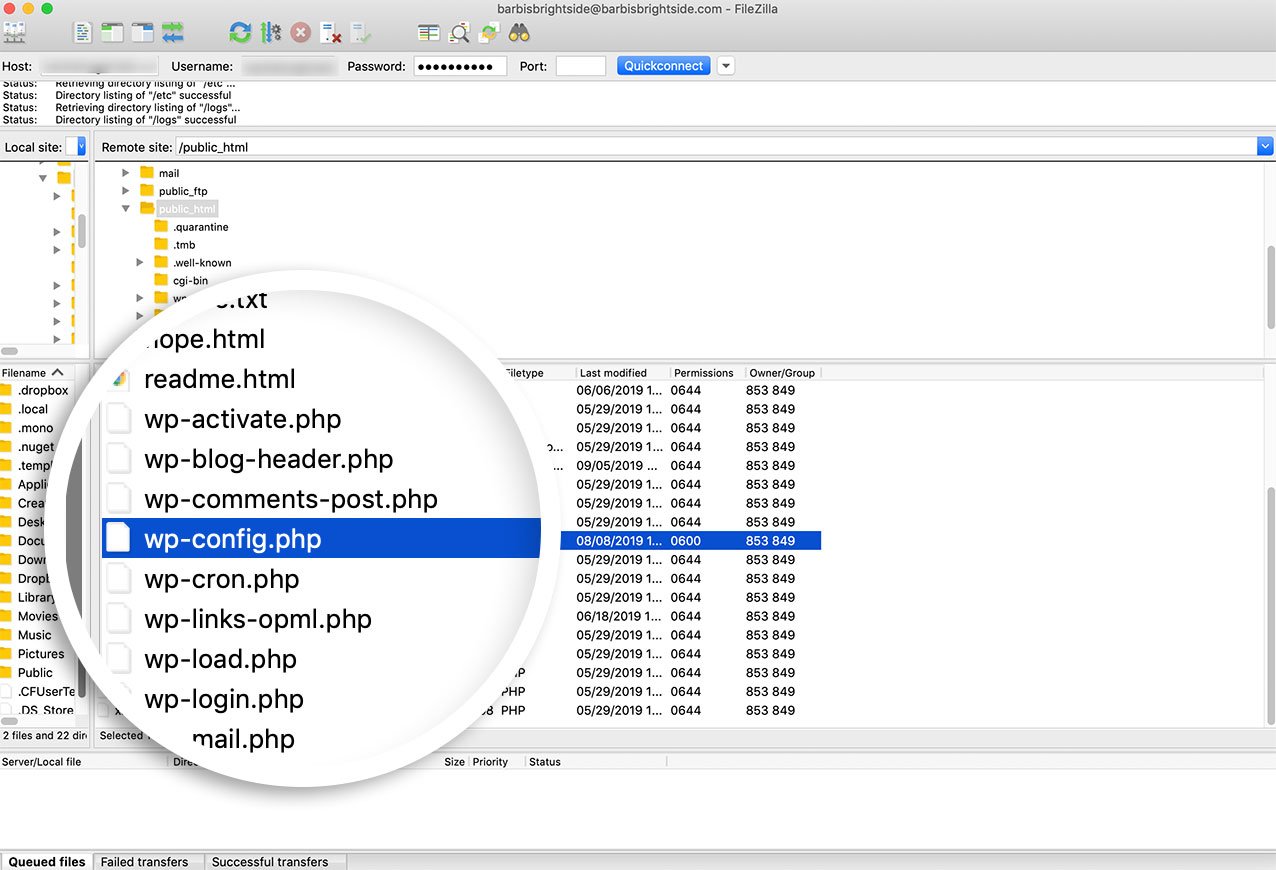
By default, WordPress debug will be disabled. To enable it, you’ll need to access your site files through either an FTP (File Transfer Protocol) or your server’s cPanel.
To learn more about FTP, please check out this article from WPBeginner. Alternatively, our friends at WPBeginner also have an article on cPanel information, which you can view here.
Alternatively, you can also just install a plugin like WP File Manager to easily gain access to your server files through the WordPress admin area. To learn more about that plugin please check out their plugin on WordPress.org.
2) Editing the wp-config.php file
Once your site files are open, you’ll need to open wp-config.php for editing.
This file will be located in the root folder on your server. To learn more about the location and directory instruction, please review this article.

Locate the wp-config.php file in your site’s root directory. This file contains your site’s core configuration settings.
Find this line near the bottom of the file:
('WP_DEBUG', false);
3) Enabling debug
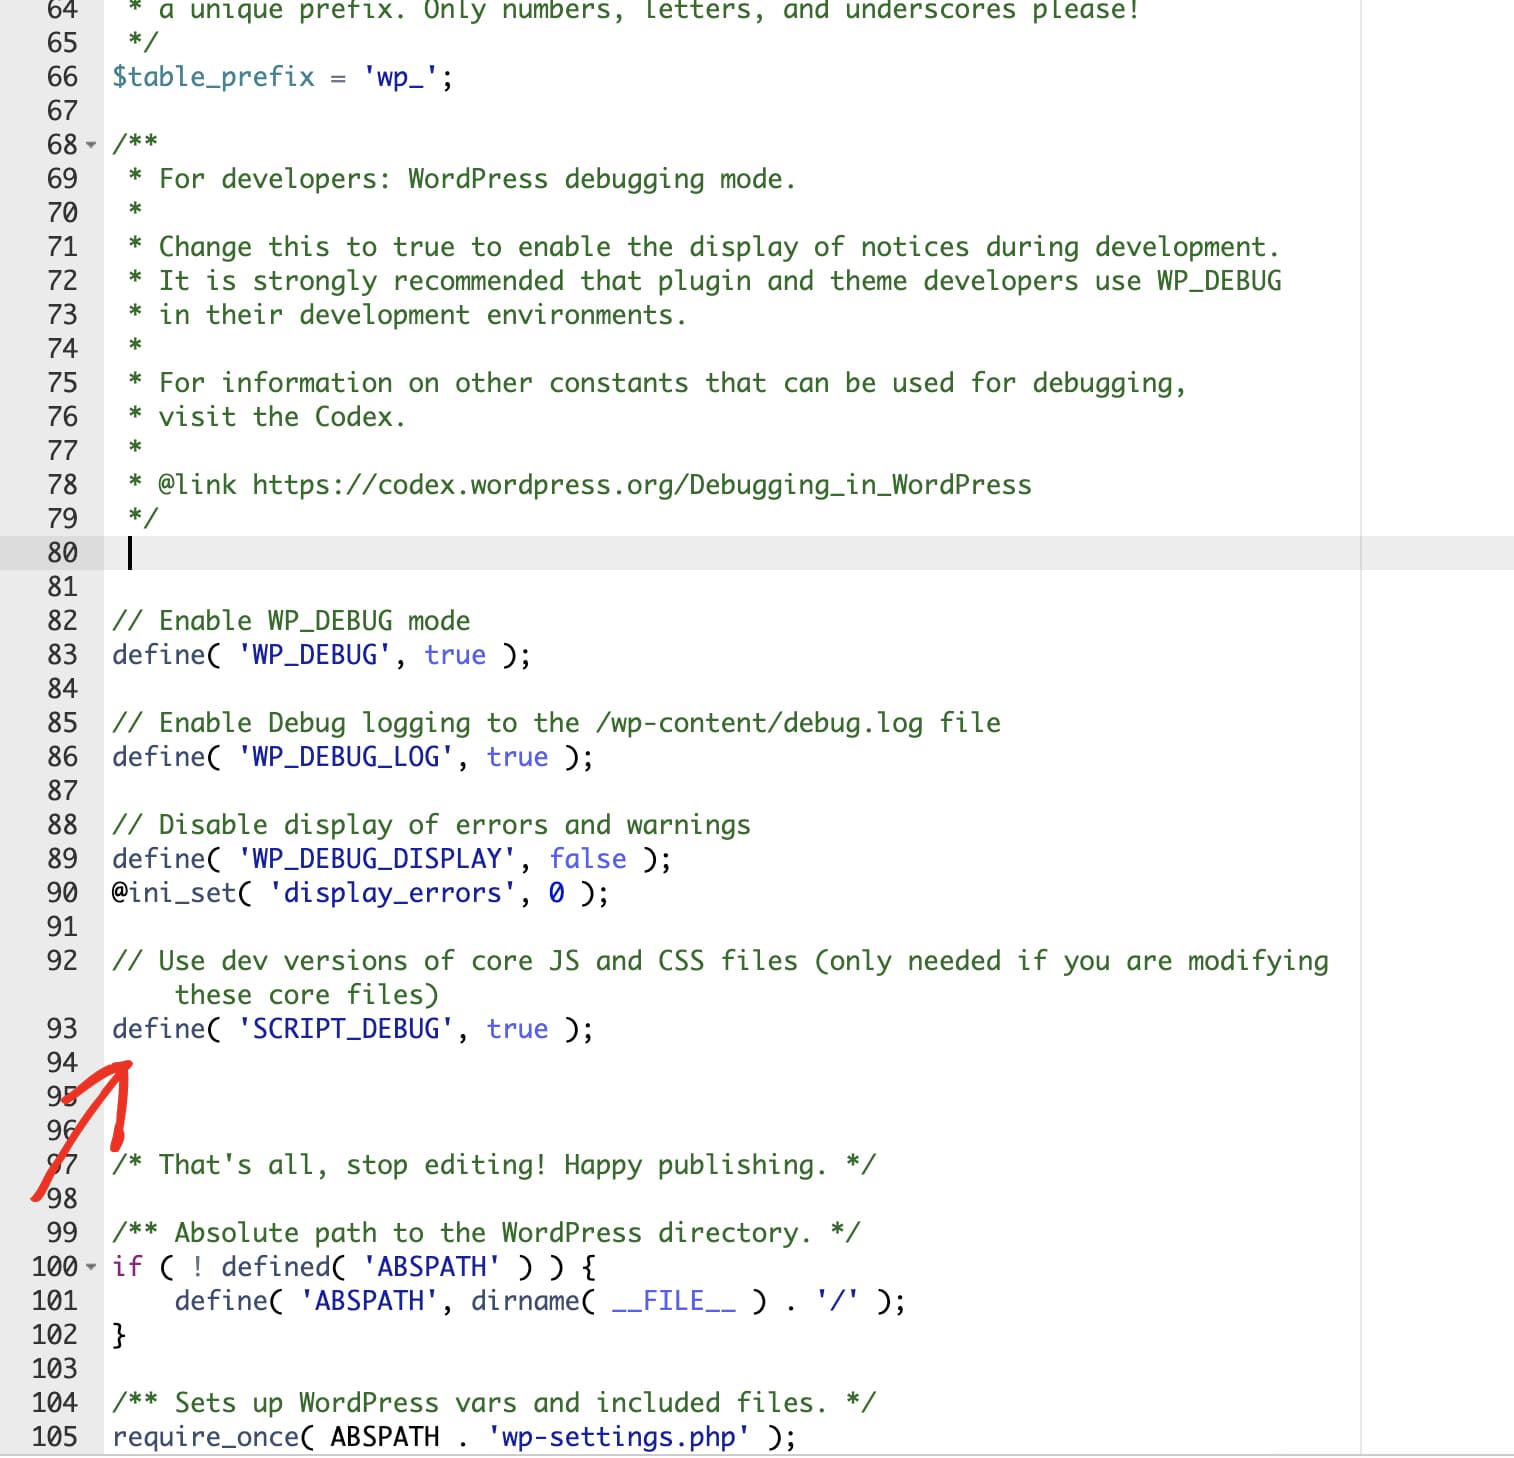
Replace it with this code snippet with debugging configuration:
// Enable WP_DEBUG mode
define( 'WP_DEBUG', true );

// Enable Debug logging to the /wp-content/debug.log file
define( 'WP_DEBUG_LOG', true );

// Disable display of errors and warnings
define( 'WP_DEBUG_DISPLAY', false );
@ini_set( 'display_errors', 0 );

// Use dev versions of core JS and CSS files (only needed if you are modifying these core files)
define( 'SCRIPT_DEBUG', true );

This will enable debugging and, importantly, prevent any logged data from displaying on your site. Instead, a debug log will be saved to your site files.
4) Replicating the issue
After saving these changes to wp-config.php, you’ll need to return to your site and replicate the issue you saw earlier. This will ensure that it gets recorded in the new error log.
5) Viewing the debug log
Then, you can return to your site files and open https://yoursitename.com/wp-content/debug.log
The contents of an error log can vary a lot depending on the cause and number of issues, but now you should be able to see extra details, such as a file path to the source of a code error, to help you better track down the issue.
For more detailed information about WordPress debugging, see the official WordPress Debugging Documentation.
