### [What Is a Likert Scale? Examples + How to Build One](https://wpforms.com/beginners-guide-what-is-a-likert-scale-and-how-to-use-it/)
**Published:** July 3, 2018
**Author:** Hamza Shahid
**Excerpt:** Want to know what a Likert scale is and how to actually use one on your WordPress site?
Measuring how people feel about something is tricky. Open-ended survey responses are a pain to sort through, and a simple yes/no rarely tells you the full story.
In this guide, I'll walk you through what a Likert scale is, show you real examples you can copy, and explain how I set one up in WPForms so you can start collecting better feedback today.
**Content:**
Want to know what a Likert scale is and how to actually use one on your WordPress site?
Measuring how people feel about something is tricky. Open-ended survey responses are a pain to sort through, and a simple yes/no rarely tells you the full story.
In this guide, I’ll walk you through what a Likert scale is, show you real examples you can copy, and explain how I set one up in WPForms so you can start collecting better feedback today.
- [What Is a Likert Scale?](#whatisalikertscale)
- [Likert Scale Examples](#likertscaleexamples)
- [5-Point Likert Scale Example](#aioseo-5-point-scale-example-14)
- [3-Point Likert Scale Example](#aioseo-3-point-likert-scale-example-19)
- [7-Point Likert Scale Example](#aioseo-7-point-likert-scale-example-22)
- [How to Create a Likert Scale in WordPress](#howtosetupalikertscale)
- [Step 1: Decide What to Measure](#decide-measure)
- [Step 2: Create Likert Scale Indicator Questions](#likert-indicator)
- [Step 3: Decide on Likert Scale Responses](#likert-response)
## What Is a Likert Scale?
We’ve all been asked on a survey how much we agree or disagree with a statement. That’s a Likert scale. It’s a type of rating scale, often found on [survey forms](https://wpforms.com/create-a-survey-form-in-wordpress-step-by-step/), that **measures how strongly people feel about something.**
It’s named after American psychologist Rensis Likert, who introduced it in 1932 as a way to turn opinions into numbers researchers could actually work with.
A Likert scale is the workhorse of customer satisfaction surveys, employee feedback forms, product reviews, event questionnaires, and a hundred other places you’ve probably seen it and didn’t know the name.
### Likert Scale Examples
Likert scales are perfect for encouraging respondents to answer detailed questions about your business. For example, you might use a Likert scale to measure how people feel about products, services, or experiences based on your survey research.
The whole point is to capture **how strongly people feel**, not just whether they feel positively or negatively. A yes/no question tells you direction. A Likert scale tells you intensity.
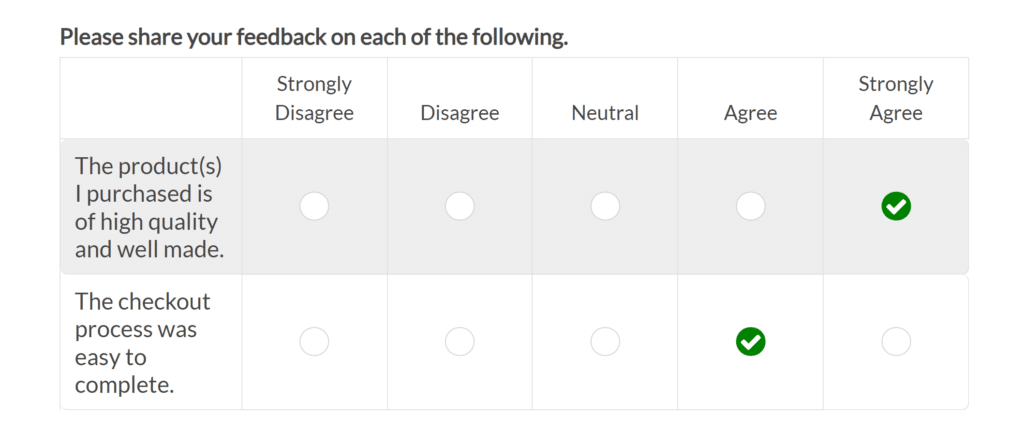
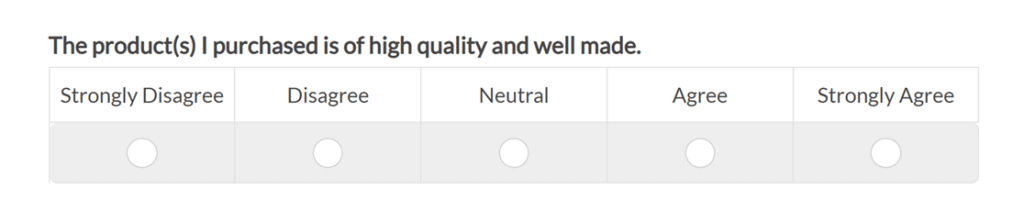
#### 5-Point Likert Scale Example
Each response gets a numeric value behind the scenes (1 through 5 in this case), which is what makes the data easy to analyze later. You’re averaging numbers, spotting trends, and comparing segments.
**Here is an example of a 5-point Likert scale**:
While 5-point Likert scale surveys are the most common, they’re not the only type. It’s also fairly common for companies to use 3-point or 7-point Likert scales.
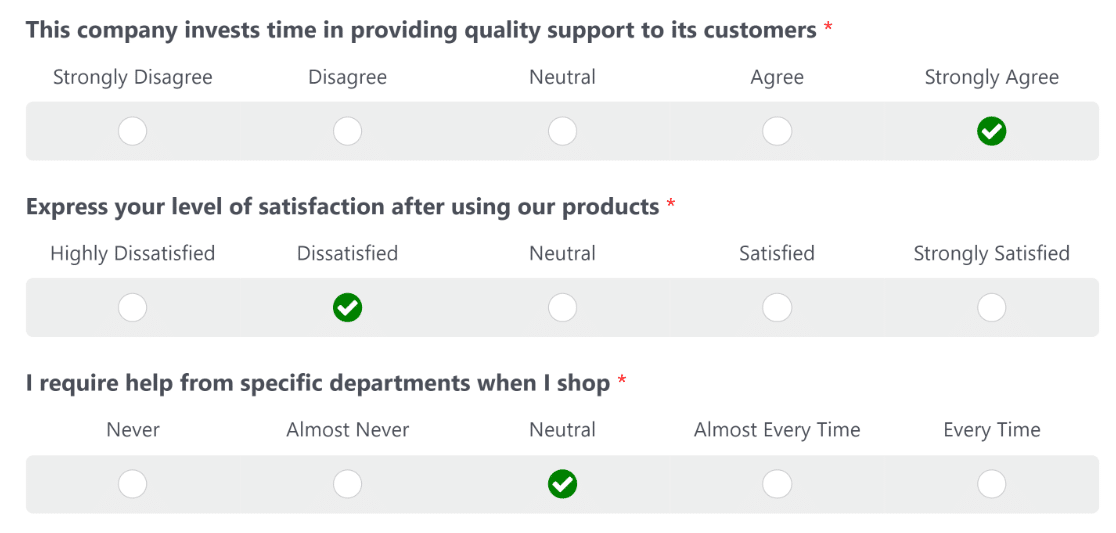
#### 3-Point Likert Scale Example
3-point scales work well when you need a quick pulse check and don’t care about fine-grained differences. The tradeoff is precision.
You’ll lose the ability to tell “somewhat satisfied” from “very satisfied,” which can matter a lot in a customer experience survey.
**Here’s an example of a 3-point Likert scale:**
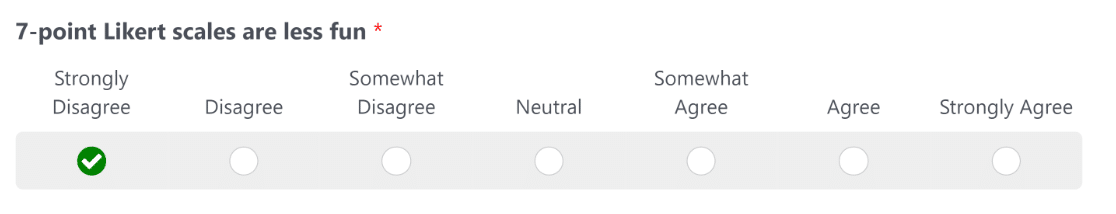
#### 7-Point Likert Scale Example
The larger the interval you use for your Likert scale, the more precisely you can measure the opinions of your audience. And the shorter the scale, the smaller the precision.
However, anything bigger than 7 and respondents start picking options at random just to get through the form.
**And here’s a 7-point Likert scale example:**
In most cases, a 5-scale Likert scale provides the best balance between user experience and the precision of responses. But if you need to, you can also use simpler or more complex Likert scales by increasing or decreasing the range of options.
### Types of Likert Scale Questions
The number of points is only half of the Likert scale design decision. You also need to pick **what** you’re measuring, because the scale labels change based on the dimension.
Here are the most common Likert scale types and what each one measures best.
- **Agreement:** Strongly disagree, Disagree, Neutral, Agree, Strongly agree. The classic. Use this when you’re asking about beliefs, opinions, or attitudes toward a statement.
- **Satisfaction:** Very dissatisfied, Dissatisfied, Neutral, Satisfied, Very satisfied. Best for customer experience surveys and post-purchase feedback.
- **Frequency:** Never, Rarely, Sometimes, Often, Always. Use when you want to know how often someone does something or experiences something.
- **Quality:** Very poor, Poor, Fair, Good, Excellent. Works well for rating features, products, or services on a general quality axis.
- **Importance:** Not at all important, Slightly important, Moderately important, Important, Extremely important. Useful when you’re prioritizing features or understanding what matters to your audience.
- **Likelihood:** Not at all likely, Slightly likely, Moderately likely, Likely, Extremely likely. The backbone of NPS-style questions and purchase intent research.
Most of these are what researchers call **bipolar scales**. They measure both positive and negative responses with a neutral midpoint in between. A frequency scale like “never to always” is actually **unipolar**, because both ends are positive descriptors of the same thing (how often), just with different magnitudes.
If you want to see more ready-to-use examples, check out my collection of [sample Likert scale questions](https://wpforms.com/sample-likert-scale-questions-for-wordpress-survey-forms/) you can drop right into your forms. For a related format that presents multiple Likert questions in a grid, take a look at the [matrix question](https://wpforms.com/matrix-question-surveys-polls/) field in WPForms.
### When to Use a Likert Scale
Likert scales shine when one question and one answer won’t cut it. If you’re trying to measure something complex, like customer satisfaction or brand perception, a single yes/no won’t give you anything useful.
A Likert scale lets you ask several indicator questions that all feed into a bigger picture. Here’s when I reach for a Likert scale.
- **Customer satisfaction surveys:** Rate specific aspects of an experience (pricing, support, product quality) on a satisfaction scale and average the results. See more ideas in our [customer satisfaction survey](https://wpforms.com/customer-satisfaction-survey-examples/) examples.
- **Event feedback:** After a webinar, conference, or training session, ask attendees to rate the venue, content, speakers, and overall experience. Much cleaner than asking “how did it go?”
- **Product feedback:** Measure how strongly users agree with statements about your product (“the onboarding was easy”, “I found what I needed quickly”).
- **Employee engagement:** Gauge morale, manager effectiveness, workload satisfaction, and team culture without forcing people to write paragraphs.
- **NPS companion questions:** Pair a Likert scale with your main [Net Promoter Score (NPS) survey](https://wpforms.com/nps-survey/) to understand the “why” behind a score.
- **Market research:** Measure interest in new features or products before you build them.
The pattern is the same every time. When you’re studying something influenced by multiple factors, break it into 3 to 7 indicator questions on a Likert scale and analyze them together.
### How to Create a Likert Scale in WordPress
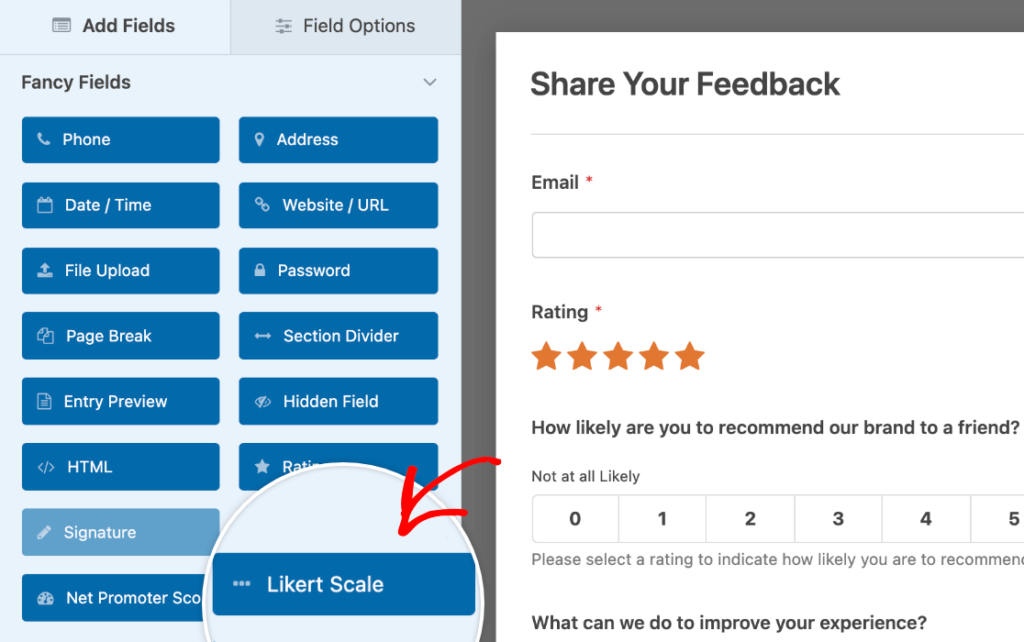
So where does WPForms fit in all this? I’ve tried a lot of form builders, and WPForms is the one I keep coming back to for survey work, because it has a dedicated Likert Scale field built right into the drag-and-drop builder.
You drag the Likert Scale field onto your form, type in your questions and response options, and you’re done. It also plays nicely with the 2,100+ [WordPress form templates](https://wpforms.com/templates/) in the library, so you can start from a prebuilt survey and just edit it to fit.
For a full walkthrough of the field settings, check out the step-by-step guide on [how to add a Likert scale to your WordPress forms](https://wpforms.com/how-to-add-a-likert-scale-to-your-wordpress-forms-step-by-step/). If you’re new to Likert scales and aren’t sure how to design the questions themselves, here’s the framework I use.
#### Step 1: Decide What to Measure
Before you touch the form builder, figure out exactly what you want to learn. This one decision shapes every question you ask.
The thing you’re measuring needs to work on a scale. That means it has to have two clear extremes (strongly agree vs strongly disagree, very satisfied vs very dissatisfied) with room for a neutral middle.
If the thing you’re measuring is binary (they either bought it or they didn’t), a Likert scale isn’t the right tool. Here are some common things you can measure with a Likert scale.
- **Agreement:** Strongly agree to strongly disagree
- **Frequency:** Often to never
- **Quality:** Very good to very bad
- **Likelihood:** Definitely to never
- **Importance:** Very important to unimportant
These are all bipolar scales because they run from one end of the sentiment to the other with a neutral midpoint. You can apply these to your business in all kinds of ways.
- Ask for product reviews
- Get feedback about your [WordPress event registration](https://wpforms.com/how-to-make-an-event-registration-form-in-wordpress/) process
- Find out how people feel about new products
- Ask people to rate customer support
- Get feedback on your pricing options
- Measure the impact of your branding, and much more
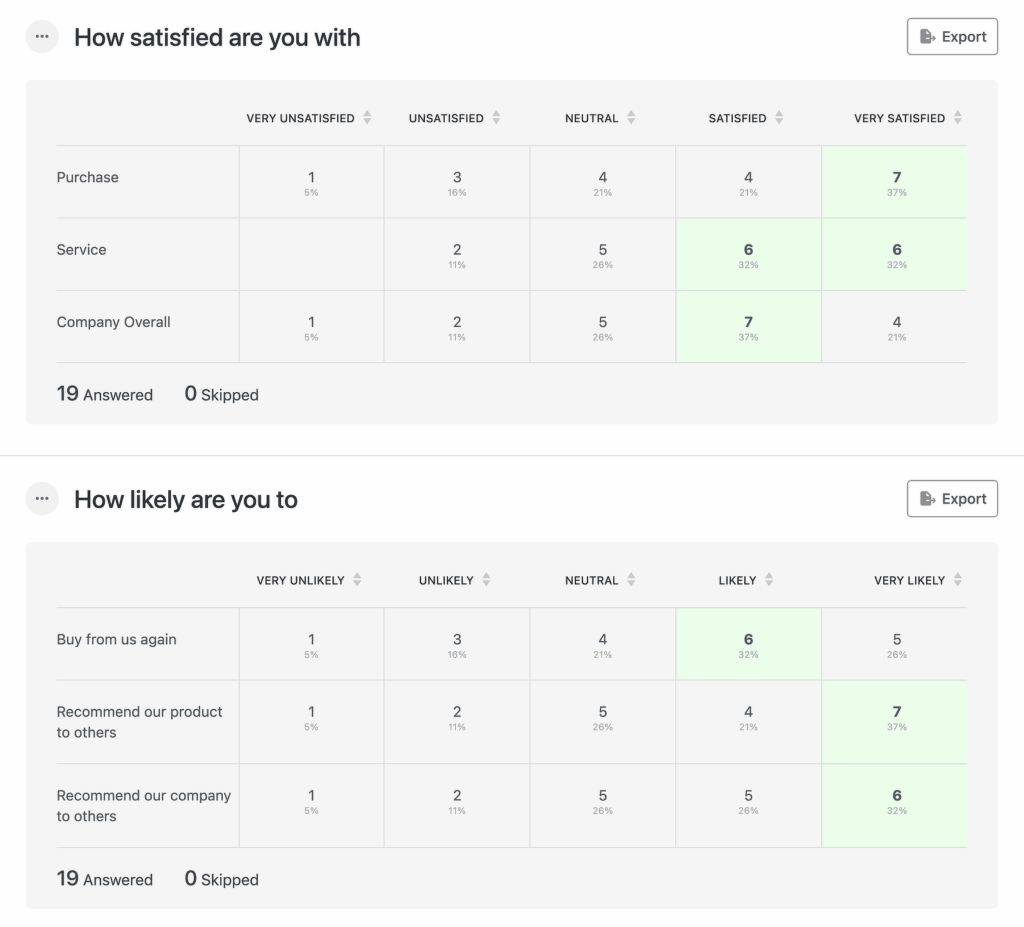
Once you’ve collected responses, Likert data is easy to work with because aggregating the numbers makes patterns jump out. Here’s an example of what responses look like inside the [Surveys and Polls addon](https://wpforms.com/features/surveys-and-polls-addon/) report view.
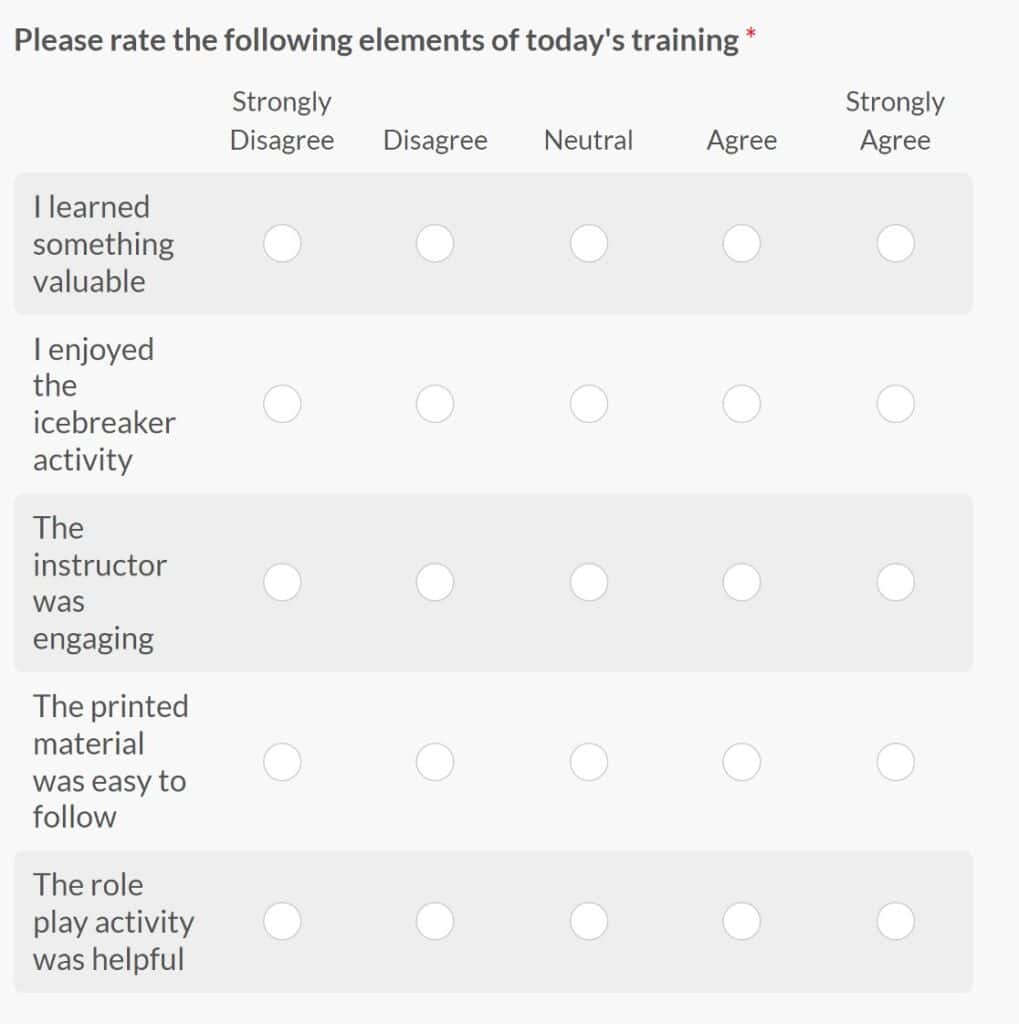
#### Step 2: Create Likert Scale Indicator Questions
A Likert scale works best when you ask several related questions that all measure the same underlying thing. Each question is called an **indicator question**, and together they paint a complete picture.
Say you want to measure customer satisfaction. One question won’t capture it, because satisfaction depends on perceived quality, pricing, speed of service, support experience, and a bunch of other factors. You’d ask a handful of Likert questions, one per factor, and look at them as a group.
Here’s an example of what good indicator questions look like.
To get useful answers, follow these [survey question best practices](https://wpforms.com/survey-question-best-practices-for-boosting-form-conversions/):
- Be specific about what you’re asking
- Cater to your target audience using terms they’ll understand
- Avoid biased survey questions that nudge people toward a particular answer or force them to pick between extremes
- Don’t ask long, compound questions. You’ll end up asking two questions at once and leave the respondent unsure how to answer.
The more precise your questions are, the more useful your results will be.
#### Step 3: Decide on Likert Scale Responses
The last piece is picking your response options. You’ve already decided what you’re measuring. Now you need to pick the exact labels people will choose from.
A few rules I follow every time.
- **Stay odd**: Use an odd number of response options, ideally 5 or 7. Fewer than 5 and people can’t express how they really feel. More than 7 and they feel overwhelmed and start picking at random.
- **Use words, not numbers**: If you label responses 1 through 5, people get confused about which end is positive. “Very satisfied” to “Very dissatisfied” is unambiguous.
- **Use the full range**: Make sure your options span the whole sentiment spectrum so people on either extreme have a way to answer honestly.
If you really want to impress your respondents, turn on [smart conditional logic](https://wpforms.com/features/conditional-logic/) on your Likert fields.
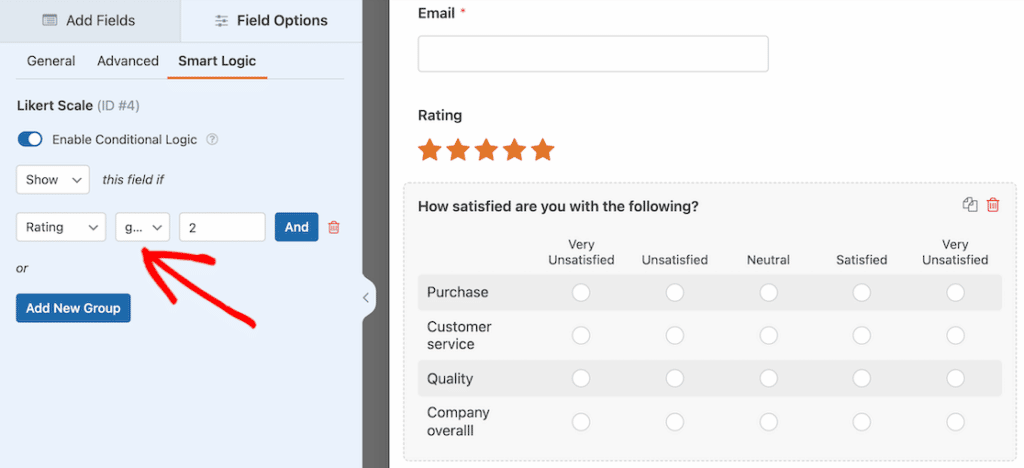Say someone rates your support as “Very dissatisfied.” With conditional logic, you can show them a follow-up field asking what went wrong.
It signals to the respondent that you actually care about their answer, and it gives you the qualitative context behind the number.
#### Step 4: Review and Analyze Your Results
Once submissions start rolling in, head to **WPForms » Entries**, open your form’s entries page, and click **Survey Results**. The new Surveys & Polls reporting experience does the heavy lifting from there.
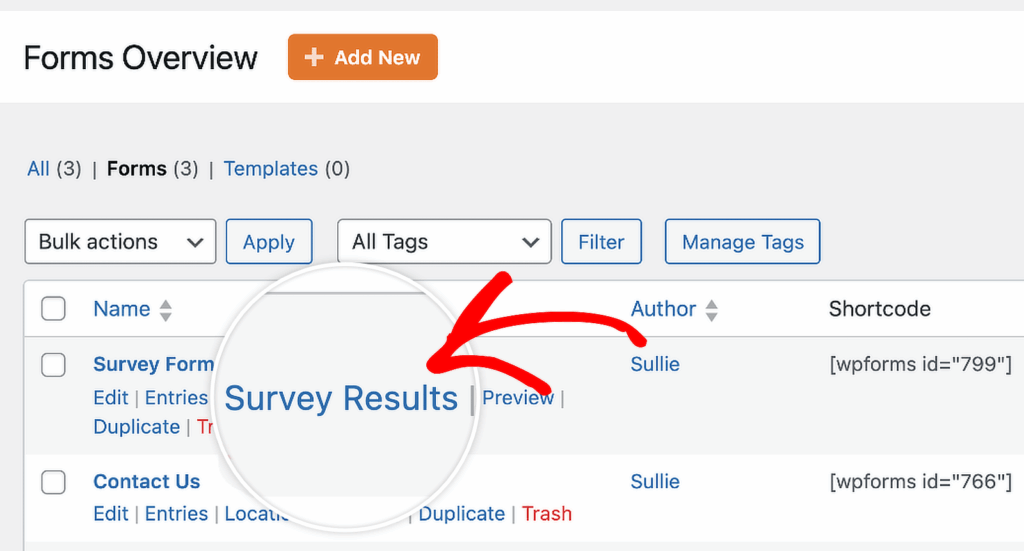Every question renders as its own filterable chart, so you can see trends at a glance instead of digging through raw data. More on that in the section below.
### How to Analyze Your Likert Scale Results With WPForms
Collecting Likert scale responses is only half the job. Turning those responses into something you can actually act on (or share with a client, or present to your team) is where most survey tools fall short.
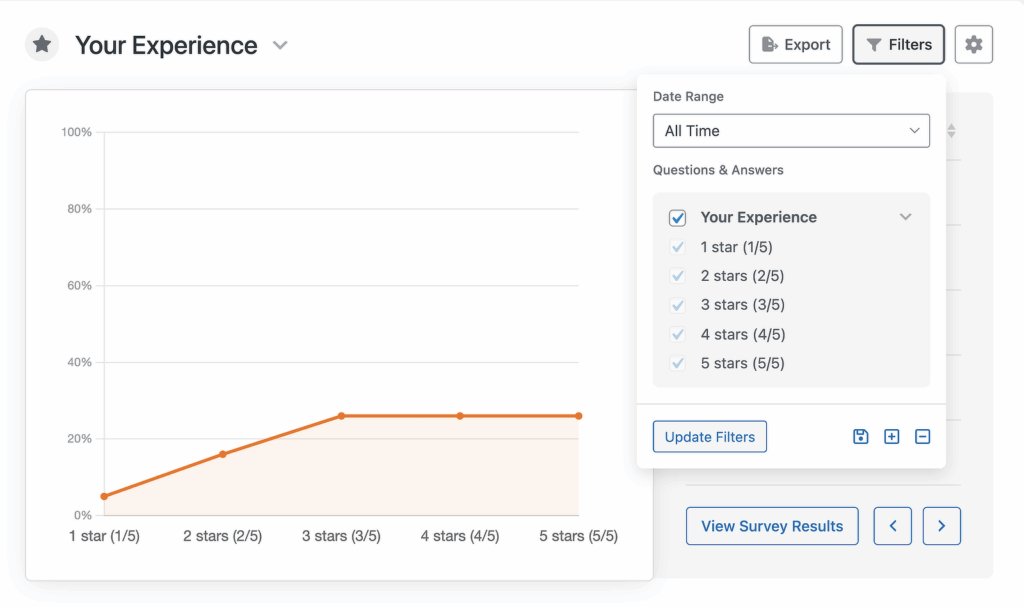
- **Powerful filtering**: Click **Filters** at the top of the page, pick a date range (Today, Last 7 days, Last 30 days, Last 90 days, Last year, or a custom window), and check the specific answer choices you want included.
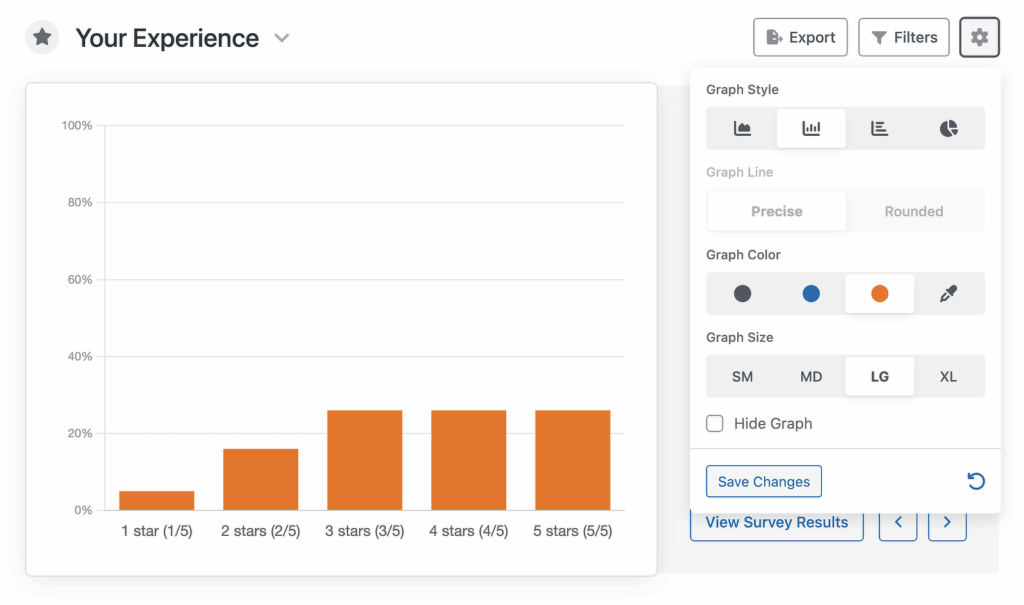
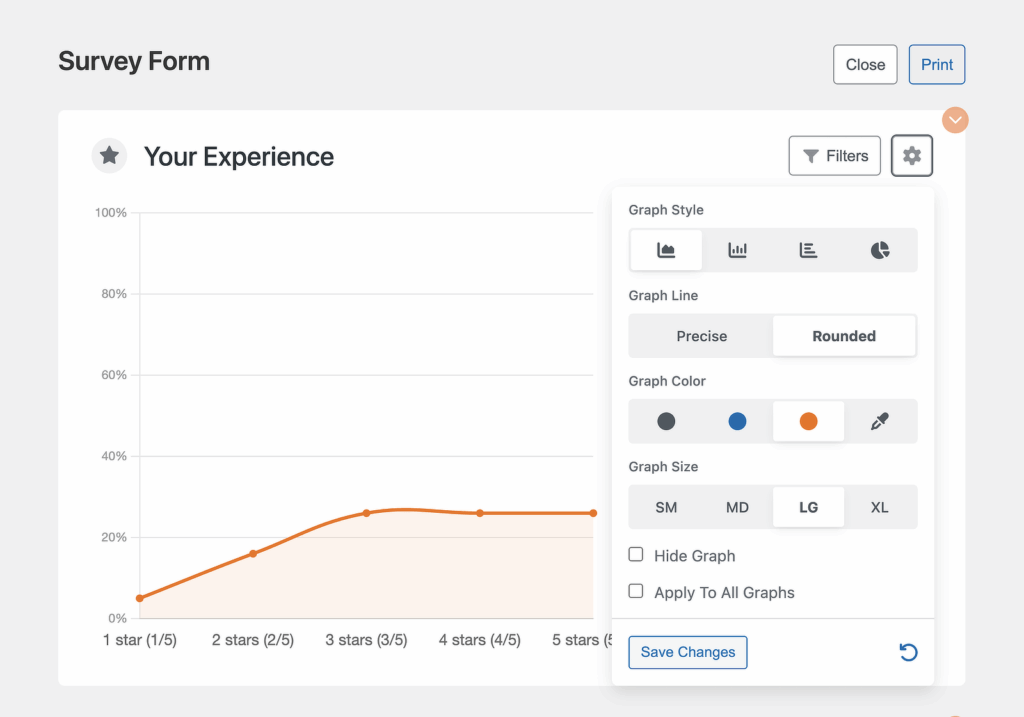
- **Graph style settings**: Click the **Settings** icon on any chart to change how it’s visualized. You can switch between line, bar, horizontal bar, and pie layouts. You can also pick a size (SM, MD, LG, or XL), choose a color from the palette, or drop in a custom hex code.
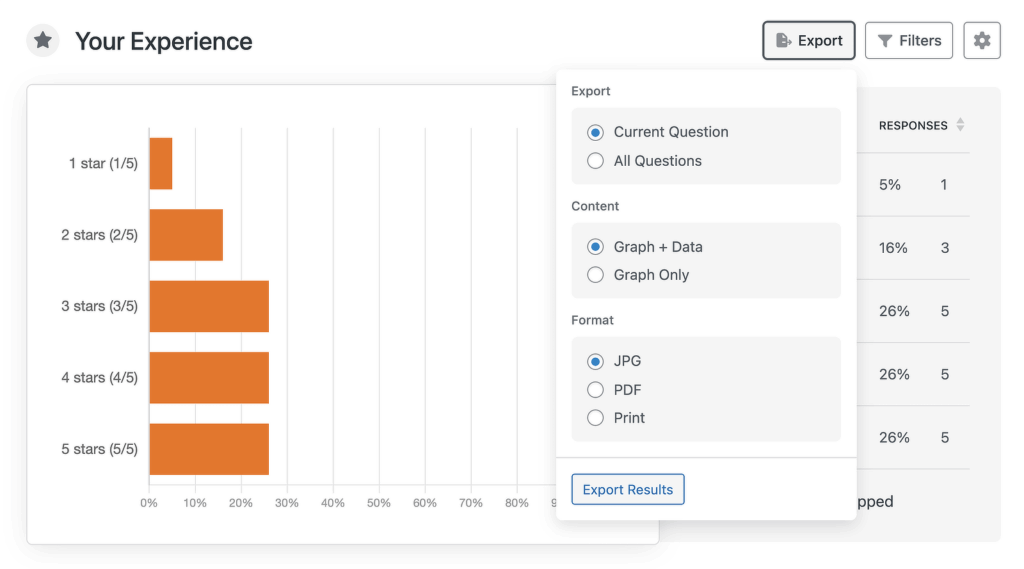
- **Advanced export options**: Click **Export** on any chart. You pick the scope (just this question or all of them), the content (graph plus data, or graph only), and the format (JPG, PDF, or Print). Exporting takes a few seconds.
- **Print preview with custom layouts**: You can customize graph sizes, styles, and filters specifically for your print layout, and those print settings won’t overwrite your actual entry settings. It means you can build one tidy printed report without breaking your live dashboard.
You can also pipe your Likert data out to a spreadsheet if that’s where you prefer to analyze it. The [WPForms Google Sheets addon](https://wpforms.com/how-to-connect-a-survey-form-to-a-google-sheet/) syncs every entry into a Google Sheet automatically, so you can slice the data in formulas outside WordPress.
[Try WPForms Surveys and Polls Now](https://wpforms.com/pricing/)
### FAQs About Likert Scales
What is a Likert scale, and how do you design one that actually gives you useful data? These are the questions I get asked most often about Likert scale surveys, pulled from conversations with WPForms users and common questions floating around the WordPress community.
#### What does Likert mean?
Likert is the last name of the inventor, American social psychologist Rensis Likert. Likert spent his career studying management and attitudes at the University of Michigan, where he also served as director of the Survey Research Center.
#### Why use Likert scales?
Use a Likert scale when you want to measure the strength of agreement or sentiment around a statement, not just a yes/no answer. They’re especially useful for customer satisfaction surveys because they turn subjective opinions into quantitative data that’s easy to aggregate and analyze.
#### What are the risks of using Likert scales?
The biggest risk is making your scale too long. A 10-point Likert scale can lead to response bias, because respondents just start picking at random to get through the form.
Watch out for central tendency bias too (where people default to the middle option) and extreme response bias (where people pick only the far ends). Asking precise, specific questions and using 5 to 7 response options keeps both problems under control.
#### How can I analyze Likert scale survey questions?
The easiest way is to use the [WPForms plugin](https://wpforms.com/pricing/) with the Pro license. The Surveys and Polls addon has reporting built right in, so you get filterable charts, export options, and a consolidated Survey Results page without touching another tool.
If you prefer working in spreadsheets, the WPForms Google Sheets addon syncs entries automatically so you can analyze the data outside WordPress.
#### How many options should a Likert scale have?
5 or 7 is the sweet spot. 5 points give you a clear neutral middle plus two degrees of positive and negative sentiment, and readers understand it without thinking. 7 points add more precision if you’re running deeper research. Anything below 3 or above 7 usually hurts data quality more than it helps.
#### Is a Likert scale qualitative or quantitative?
A Likert scale produces ordinal quantitative data. Responses are ordered (strongly disagree ranks below disagree, which ranks below neutral, and so on), and each response gets mapped to a number, which is why you can average results and run statistics on them. The underlying sentiment is qualitative, but the output is quantitative.
### Next, Check Out More Survey Resources
Now you’ve got a solid foundation for building Likert scale surveys that actually give you useful data. The next step is putting it to work on your own site.
If you want another way to gauge customer loyalty, take a look at how to [create a Net Promoter Score (NPS) survey](https://wpforms.com/how-to-create-a-net-promoter-score-nps-survey-in-wordpress/) in WordPress. NPS pairs really well with Likert questions in the same form. For a wider look at your options, check out our roundup of the [best survey plugins for WordPress](https://wpforms.com/best-wordpress-survey-plugins/).
[Build Your Likert Scale Survey Now](https://wpforms.com/pricing/)
Ready to build your form? Get started today with the easiest WordPress form builder plugin. [WPForms Pro](https://wpforms.com/pricing) includes lots of free templates and offers a 14-day money-back guarantee.
If this article helped you out, please follow us on [Facebook](https://facebook.com/wpforms) and [Twitter](https://twitter.com/easywpforms) for more free WordPress tutorials and guides.
**Categories:** Marketing
**Tags:** conditional logic, likert scale, NPS form field, survey form
---